ETF Action: Research
ETF Playbooks
(*Available to Subscribers Only)
Weekly reviews of popular ETF market segments, including visualizations of major market moves, performance highlights, technical trends and more.
Markets covered include:
DOWNLOAD A SAMPLE
ETF Playbooks Archives
Emerging Markets Large Cap Category Report
4.16.2024
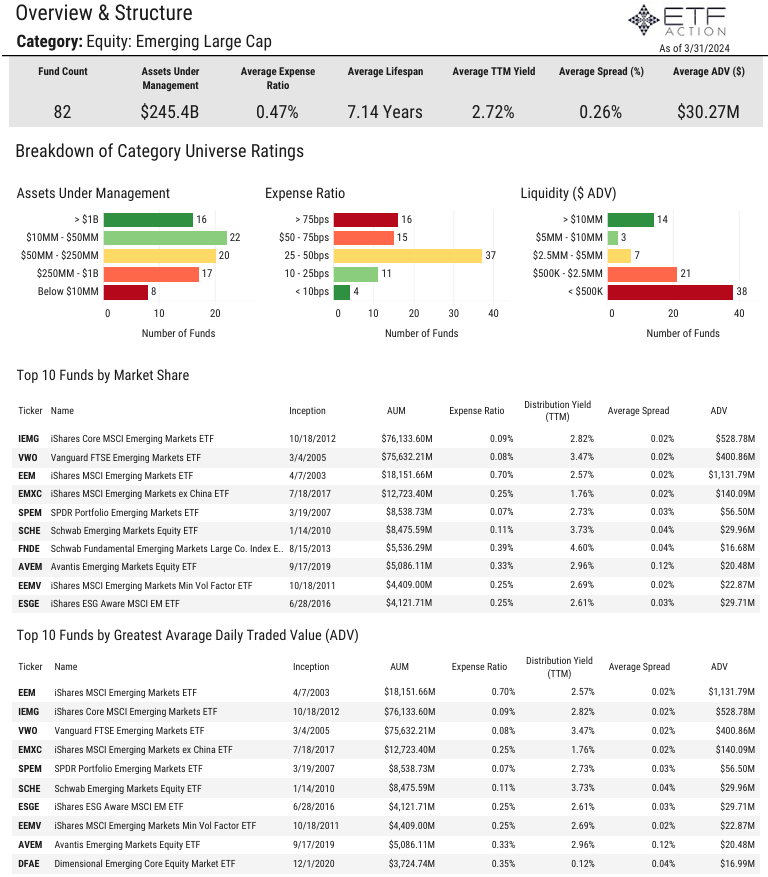
- The Equity: Emerging Large Cap category is made up ofo 82 ETFs with $245.5 billion in total assets under management
- 16 of the ETFs in the category have more than $1 billion in AUM, the largest is the iShares Core MSCI Emerging Markets ETF (IEMG) with $76.1 billion in AUM
- The average expense ratio is 47 bps but 16 ETFs have expense ratios above 75 bps
- The average lifespan is 7.14 years, the average TTM yield is 2.72%, and the average spread is 0.26%
- The average ADV is $30.27 million but 38 ETFs in the category have ADV below $500K
- Large Cap Emerging Market ETFs continue to see solid net inflows gathering $1.77 billion in March and $11.16 billion in the past year
- The iShares MSCI Emerging Markets ex China ETF (EMXC) saw the largest net inflows in March with $1.61 billion and has gathered more than $8.1 billion in the past year
- Just 4 ETFs in the category posted losses last month, average 1-month return was +2.12% and average 1-year return was +11.61%
- The SPDR S&P Emerging Markets Dividend ETF (EDIV) is the only ETF in the category with positve alpha (3-year) relative to the iShares MSCI ACWI ex U.S. ETF (ACWX)
- The largest average country exposures for the category are Taiwan (1841%), China (17.60%), and India (16.96%)
- The category has high average sector exposures to Financials (21.7%) and Technology (21.4%)
Health Care Category Report
4.15.2024
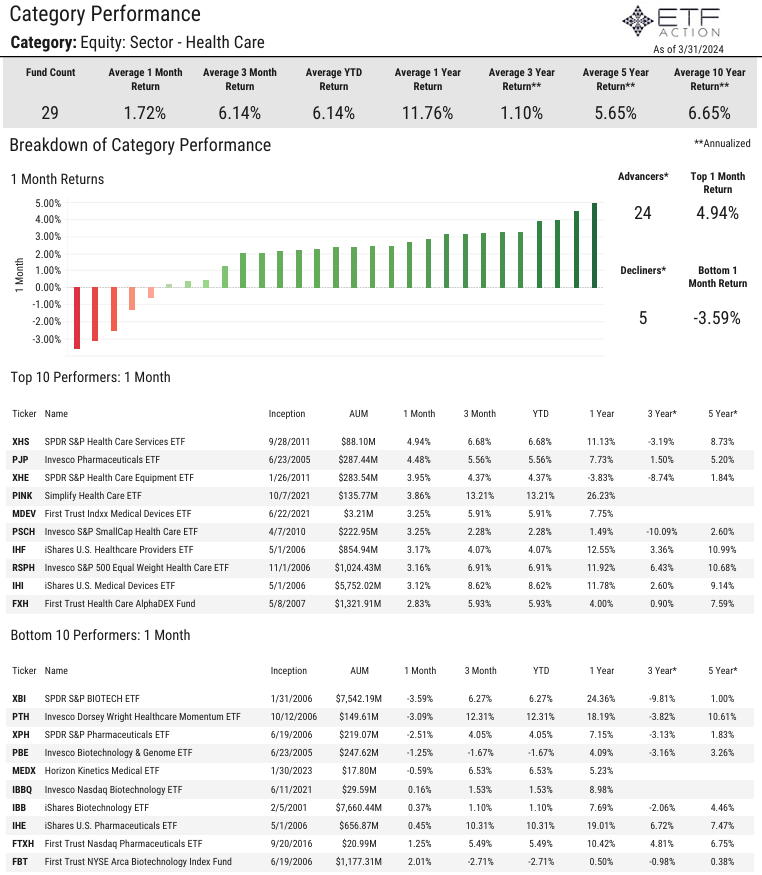
- The Equity: Sector - Health Care category is made up of 29 ETFs with $99.0 billion in total assets under management
- The Health Care Select Sector SPDR Fund (XLV) is the largest ETF in the category with $41.3 billion in AUM followed by the Vanguard Health Care ETF (VHT) with $18.2 billion in AUM
- The average expense ratio of the category is 44 bps, the average lifespan is 14.24 years, and the average TTM yield is 0.86%
- About half of the Health Care ETFs have low liquidity ratings, average daily volume for the category is $92.68 million
- XLV and the SPDR S&P Biotech ETF (XBI) are the only ETFs in the category with average daily volume above $1 billion
- Health Care ETFs saw $170 million in net outflows in March but have gathered $450 million in net inflows year-to-date
- The iShares U.S. Medical Devices ETF (IHI) gathered $85.6 million in net inflows last month while XLV saw $99.2 million in net outflows
- Most Health Care ETFs posted gains in March, average 1-month return was +1.72% and average YTD return was +6.14%
- The SPDR S&P Health Care Services ETF (XHS) and the Invesco Pharmaceuticals ETF (PJP) both climbed more than 4% on the month while XBI slid 3.59%
- The VanEck Pharmaceutical ETF (PPH) has the highest sharpe ratio (3-year) relative to the iShares MSCI ACWI ETF (ACWI) at 0.80
- Average up capture of the category is 66.32% and average down capture is 97.18%
- The category has high and above average stock concentration but is relatively diverse from a size and style perspective
- 25 of the 29 Health Care ETFs have high or above average growth ratings
- The Harbor Health Care ETF (MEDI) has the highest growth rating (4.09) while XHS has the highest value rating (4.02)
Broad Based Commodity Category Report
4.12.2024
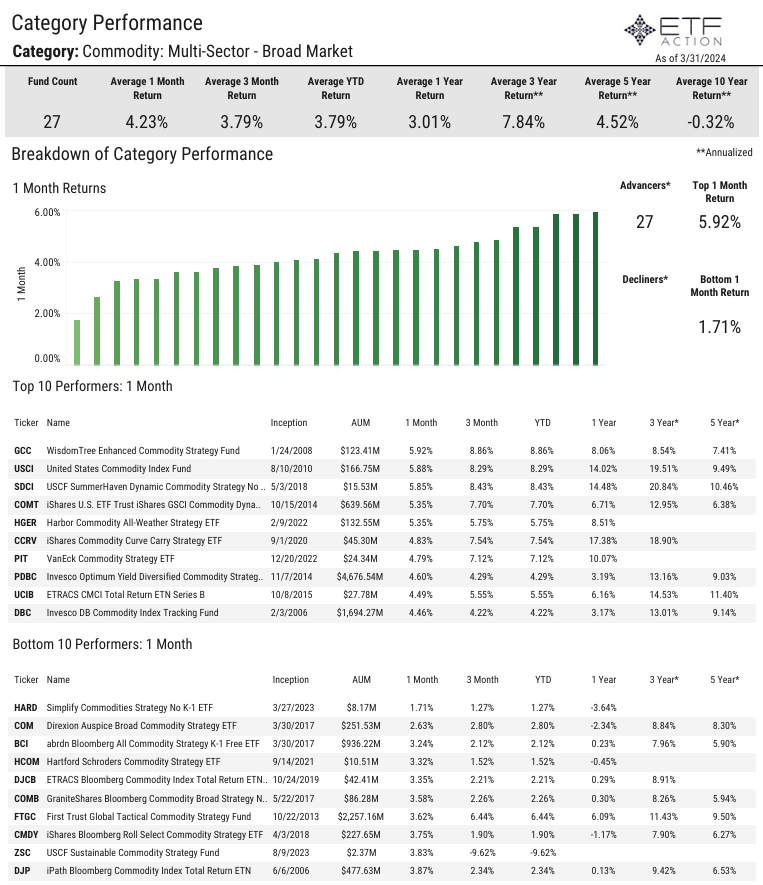
- The Commodity: Multi-Sector - Broad Based category is comprised of 27 ETFs with $13.6 billion in total assets under management
- The average expense ratio of the category is 61 bps, the average lifespan is 6.96 years, and the average TTM yield is 2.82%
- Just 4 ETFs in the category have more than $1 billion in AUM, the Invesco Optimum Yield Diversified Commodity Strategy (PDBC) is the largest with $4.7 billion in AUM
- 7 ETFs in the category have an expense ratio above 75 bps
- 9 ETFs in the category have an average daily volume of less than $500K, average ADV is $4.14 million
- Multi-Sector Commodity ETFs have seen $430 million in net outflows year-to-date and $2.43 billion in net outflows over the last year
- PDBC has seen $763 million in net outflows in the last year
- Almost ETFs in the category registered positive returns in March, average 1-month return was +4.23% and average 3-month return was +3.79%
- The WisdomTree Enhanced Commodity Strategy Fund (GCC) was the best perfomer last month, rising 5.92%
Infrastructure Category Report
4.10.2024
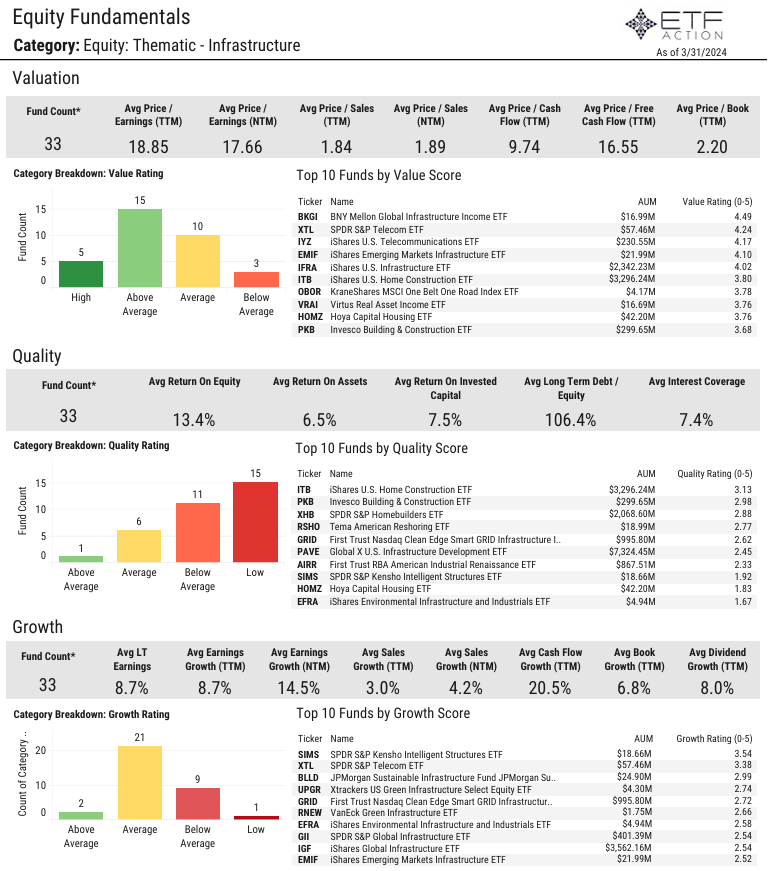
- The average expense ratio of the 33 Infrastructure ETFs is 51 bps, the average lifespan is 8.21 years, and the average TTM yield is 1.92%
- The Thematic - Infrastructure category has $24.6 billion in total assets under management, the largest ETF in the category is the Global X U.S. Infrastructure Development ETF (PAVE) with $7.3 billion in AUM
- Just 5 other ETFs in the category have over $1 billion in AUM (IGF, ITB, IFRA, NFRA, XHB)
- 21 of the 33 ETFs in the category have below $500K in average daily volume, average ADV is $17.80 million
- Infrastructure ETFs gathered nearly $1 billion in net inflows in March and have seen $2.31 billion in net inflows in the past year
- PAVE gathered $501.7 million in net inflows last month and $1.42 billion in net inflows over the last year
- Just 2 ETFs in the category posted losses in March (SRVR, XTL), average 1-month return was +3.68% and average 1-year return was +15.25%
- The SPDR S&P Homebuilders ETF (XHB) rose 8.44% last month and has surged nearly 70% in the past year
- The average 3-year average volatility relative to ACWI is 21.14%, average shapre ratio is 0.17, and average down capture is 107.15%
- The category is relatively diverse from a size & style perspective and has average stock concentration
- The highest average sector exposures for Infrastructure ETFs are Industrials (30.8%), Utilities (17.8%), and Real Estate (15.6%)
- Average price to earnings (TTM) is 18.85, average return on equity is 13.4%. and average dividend growth (TTM) is 8.0%
U.S. Small Cap Value Category Report
4.9.2024
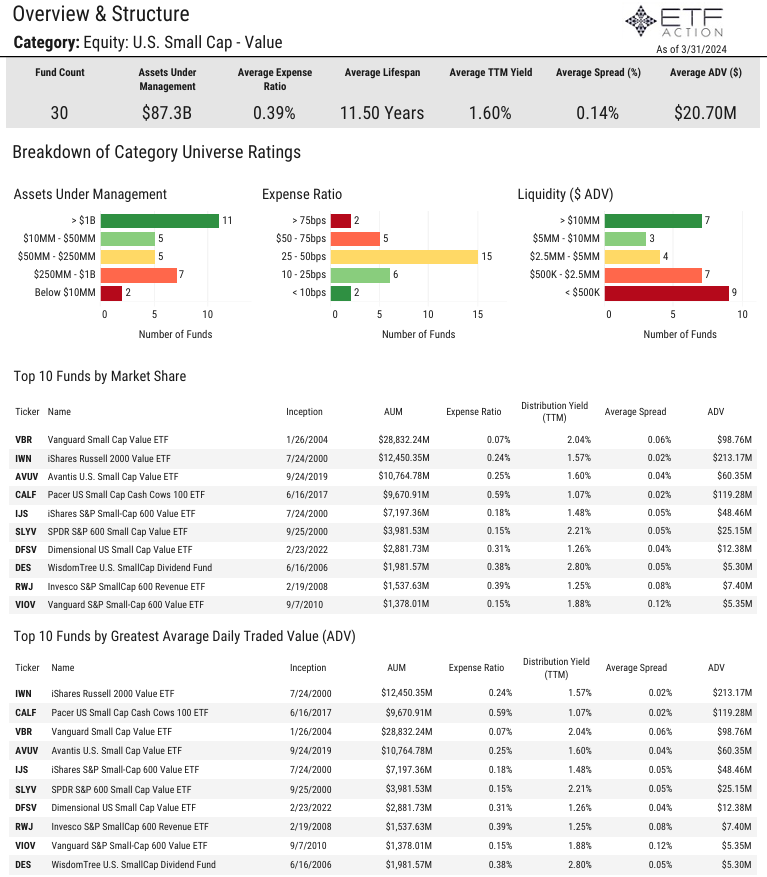
- The U.S. Small Cap - Value category is comprised of 30 ETFs with $87.3 billion in total assets under management
- The average expense ratio of the category is 39 bps, the average lifespan is 11.50 years, and the average TTM yield is 1.60%
- 11 ETFs in the category have more than $1 billion in AUM and 2 ETFs have less than $10 million in AUM
- The Vanguard Small Cap Value ETF (VBR) is the largest ETF in the category with $28.8 billion
- The average daily volume of the category is $20.70 million, the iShares Russell 2000 Value ETF (IWN) has the highest ADV with $213.17 million
- U.S. Small Cap - Value ETFs gathered $1.18 billion in net inflows in March and $4.17 billion in net inflows int the 1st quarter
- All ETFs in the category gained more than 1.60% in March, average 1-month return was +3.93% and average return for Q1 was +2.54%
- The Themes US Small Cap Cash Flow Champions ETF (SMCF, +8.20%) was the best performer last month
- The average 3-year volatility relative to the S&P 500 (SPY) was 21.75% and average correlation was 0.80
- The average top 10 holdings weight is just 12.07% and average weighted average market cap was $2.99 billion
- The category has high average sector exposure towards Financials (23.0%), Industrials (17.2%), and Consumer Discretionary (16.1%)
Real Estate Category Report
4.8.2024
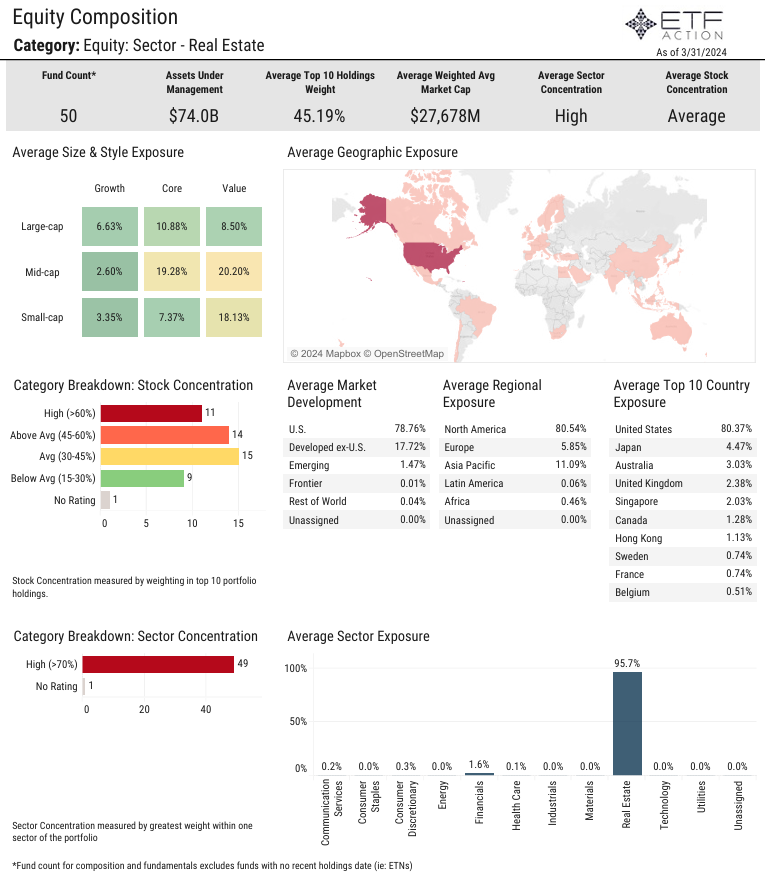
- The 50 Real Estate ETFs have $74.0 billion in assets under management, the Vanguard Real Estate ETF (VNQ) is the largest ETF in the category with $33.8 billion in AUM
- The average expense ratio of the category is 42 bps, the average lifespan is 9.33 years, and the average TTM yield is 3.17%
- 25 of the ETFs in the category have average daily volume below $500K, the iShares U.S. Real Estate ETF (IYR) has the largest ADV at $591.5 million
- Real Estate ETFs gathered $2.13 billion in net inflows in March, IYR saw the largest net inflows with $1.1 billion
- All Real Estate ETFs registered positive returns last month, average return was +3.05% and average YTD return was -1.65%
- The iShares International Developed Real Estate ETF (IFGL) and the iShares International Developed Property ETF (WPS) both jumped more than 6.4% in March
- The ALPS Active REIT ETF (REIT) has the highest sharpe ratio (3-year) relative to the iShares MSCI ACWI ETF (ACWI)
- The average top 10 holdings weight of the category is 45.19%
- The category has high average tilts to Mid-Cap Value (20.20%), Mid-Cap Core (19.28%), and Small-Cap Value (18.13%) names
- Average price to earnings (TTM) of the category is 28.02, the average return on equity is 6.3%, and the average dividend growth (TTM) is 6.9%
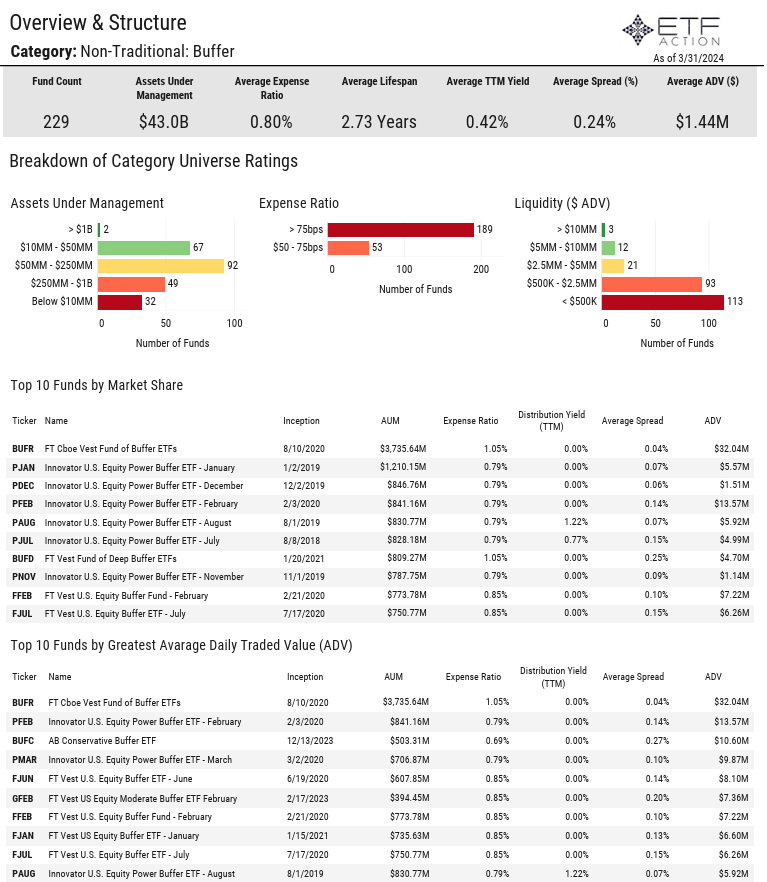
Buffer ETFs Category Report
4.5.2024
- The Non-Traditional: Buffer category is comprised of 229 ETFs with $43.0 billion in total assets under management
- The average expense ratio of the category is 80 bps, the average lifespan is 2.73 years, and the average TTM yield is 0.42%
- Just 2 ETFs in the category have more than $1 billion in AUM, the FT Cboe Vest Fund of Buffer ETFs (BUFR) is the largest with $3.7 billion in AUM
- 53 ETFs in the category have an expense ratio below 75 bps
- 113 ETFs in the category have an average daily volume of less than $500K, average ADV is $1.44 million
- Buffer ETFs gathered $90 million in net inflows in March and have seen $3.30 billion in net inflows year-to-date
- Almost all Buffer ETFs registered positive returns in March, average 1-month return was +1.32% and average YTD return was +3.91%
- The FT Vest Gold Strategy Quarterly Buffer ETF (BGLD) was the best performer last month, climbing more than 6%
- BUFR gained 1.49% in March and has jumped more than 20% over the past year
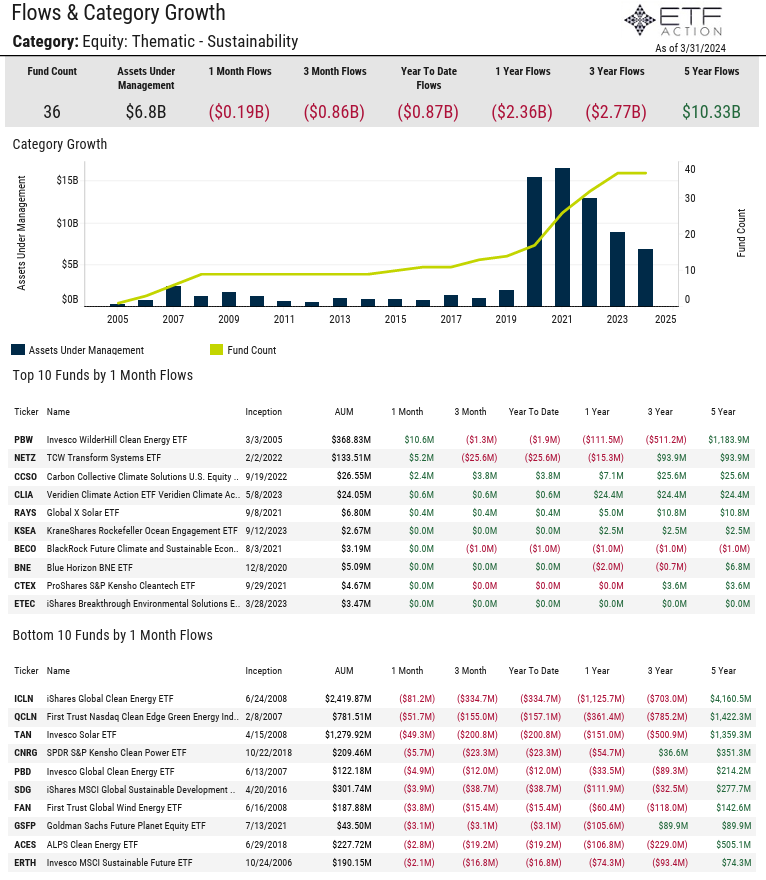
Sustainability Category Report
4.3.2024
- The average expense ratio of the 36 Sustainability ETFs is 62 bps, the average lifespan is 6.59 years, and the average TTM yield is 1.17%
- The category has relatively high expense ratios and low liquidity relative to the broader market
- 26 ETFs in the category have average ADV below $500K and just 2 ETFs in the category have assets under management greater than $1 billion
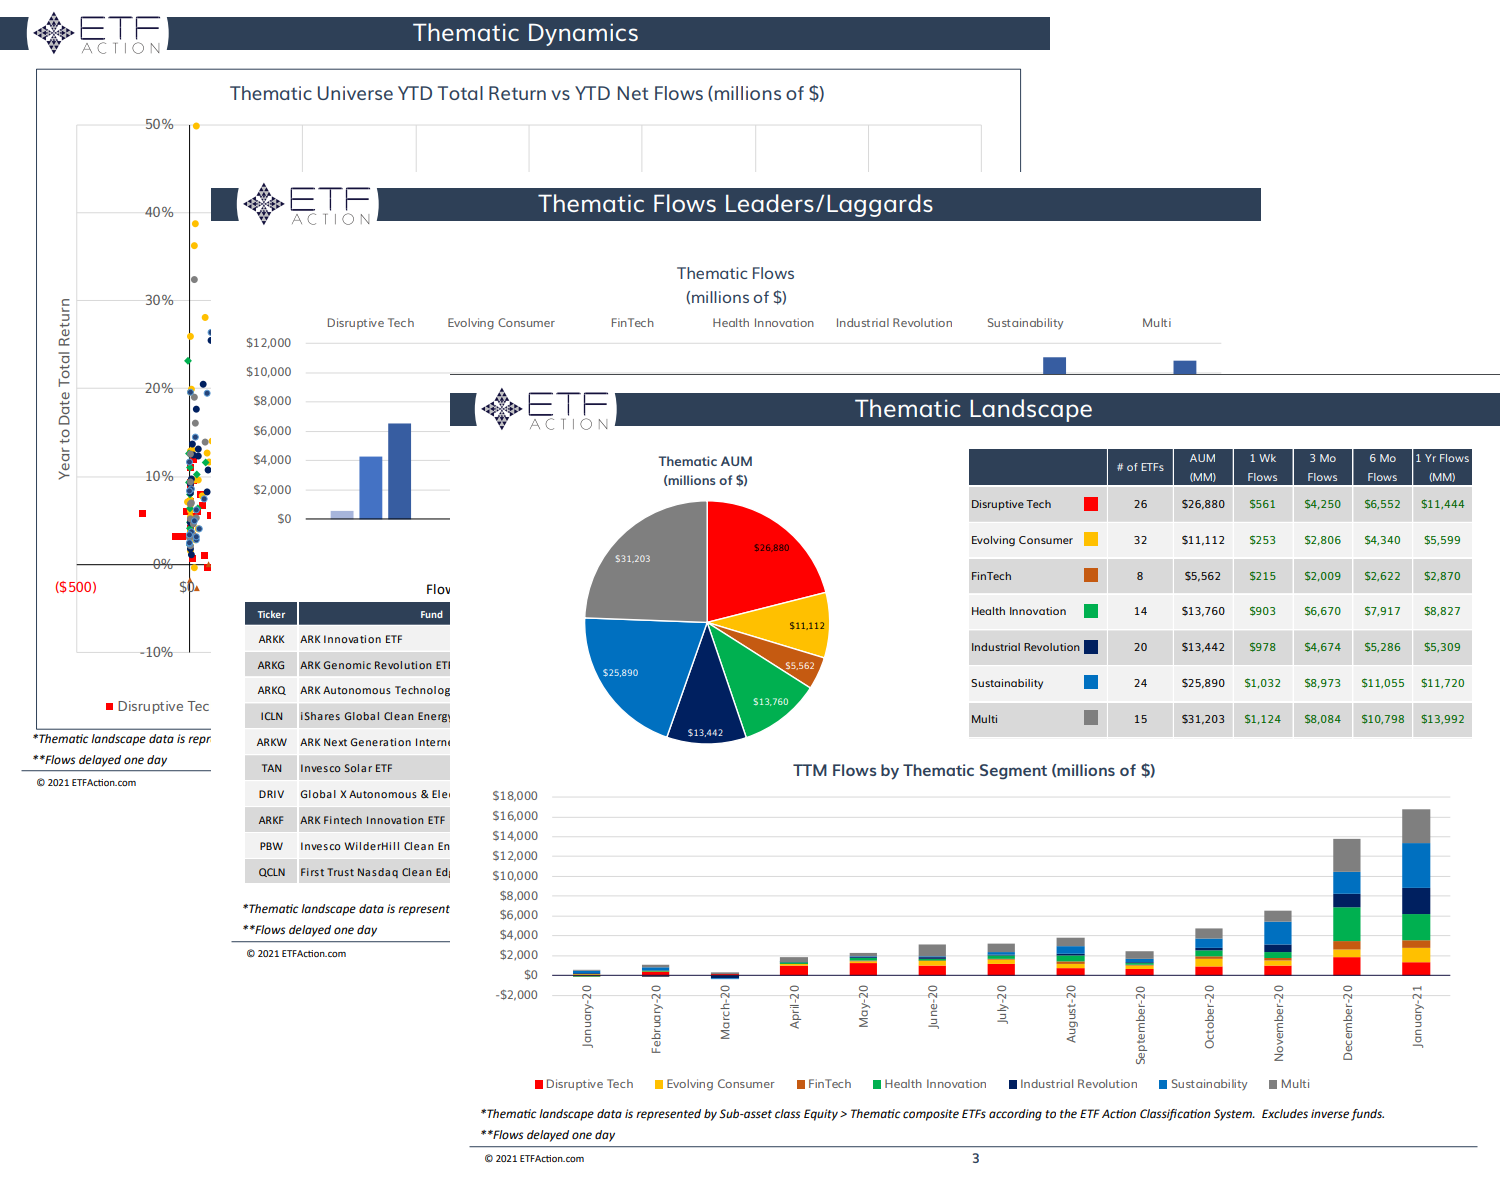
- The iShares Global Clean Energy ETF (ICLN) has $2.42 billion in AUM followed by the Invesco Solar ETF (TAN) with $1.28 billion in AUM
- Sustainability ETFs saw nearly $1 billion in net outflows in Q1 and have seen $2.36 billion in net outflows over the past year
- ICLN saw $334.7 million in net outflows in March and has seen $1.13 billion in net outflows over the past year
- The category saw mixed returns in March, the Macquarie Energy Transition ETF (PWER, +9.07%) was the top performer and the First Trust Nasdaq Clean Edge Green Energy Index Fund (QCLN, -6.95%) was the worst performer
- Average 1-year return is -12.86% and the average 3-year annualized return for the category is -6.68%
- The category has above average stock concentration and above average/ high volatility ratings
- Highest average sector exposure is Industrials (35.0%), Utilities (25.6%), and Technology (18.8%)
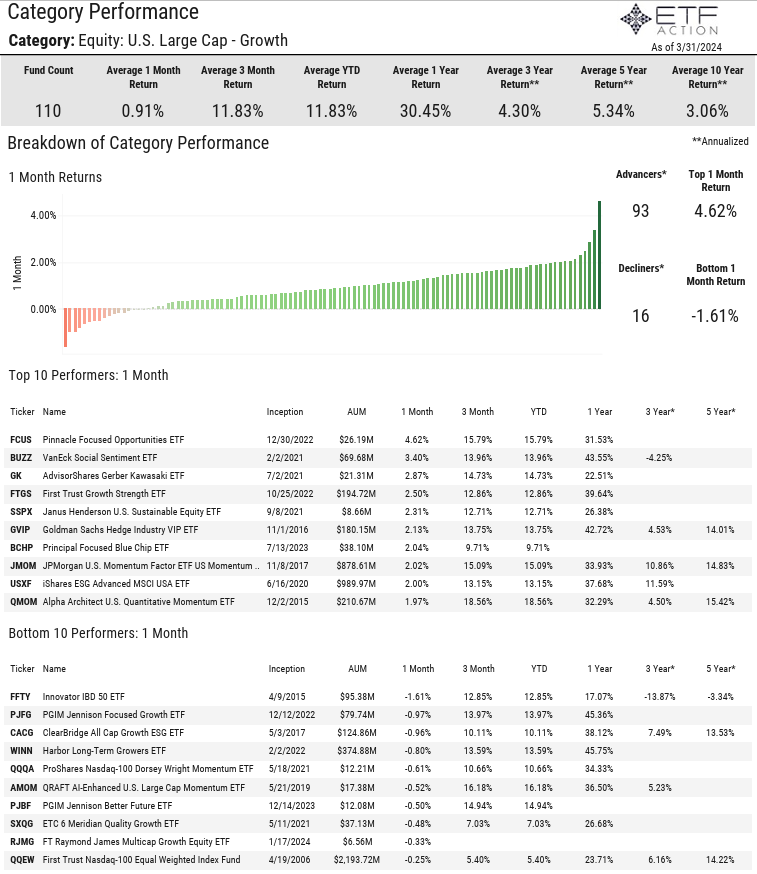
U.S. Large Cap Growth Category Report
4.3.2024
- The U.S. Large Cap - Growth category is comprised of 110 ETFs with $722.1 billion in total assets under management
- The average expense ratio of the category is 48 bps, the average lifespan is 6.79%, and the average TTM yield is 0.40%
- 29 ETFs in the category have more than $1 billion in AUM, the Invesco QQQ Trust Series I (QQQ) is the largest with $259.9 billion in AUM followed by the Vanguard Growth ETF (VUG) with $118.6 billion in AUM
- 12 ETFs in the category have expense ratios below 10 bps versus 22 with expense ratios greater than 75 bps
- U.S. Large Cap - Growth ETFs gathered $10.47 billion in net inflows in March and $24.66 billion in net inflows int the 1st quarter
- Most ETFs in the category saw positive returns in March, average 1-month return was +0.91% and average return for Q1 was +11.83%
- The Pinnacle Focused Opportunities ETF (FCUS, +4.62%) was the top performer in March
- The average 3-year volatility relative to the S&P 500 (SPY) was 21.39 and average correlation was 0.92
- The average top 10 holdings weight is 44.80% and average weighted average market cap was $802.1 billion
- U.S. Large Cap - Growth ETFs have high average sector concentration towards Technology (39.0%)
Energy Category Report
4.1.2024
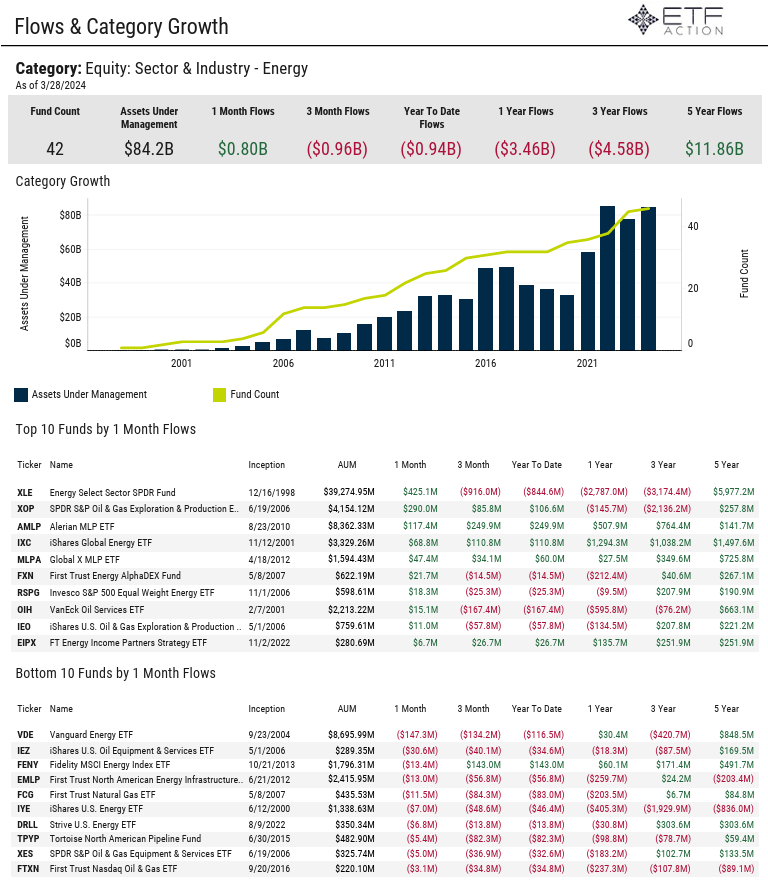
- Energy ETFs saw $960 million in net outflows in the first quarter of 2024, the Energy Select Sector SPDR ETF (XLE) saw the largest net outflows in the period with $916 million
- However, XLE gathered $425 million in net inflows in March while the SPDR S&P Oil & Gas Exploration & Production ETF (XOP) gathered $290 million in net inflows
- The average expense ratio of the 42 Energy ETFs in the category is 61 bps, the average TTM Yield is 2.75%, and the average lifespan is 10.96 years
- The total assets under management in the category is $84.2 billion, XLE is the largest ETF in the category with $39.3 billion AUM
- Just 1 Energy ETF posted losses in March, average 1-month return was +8.21%, average return in Q1 was +10.56%
- Top performer last month was the Range Global Offshore Oil Services Index ETF (OFOS, +17.00%)
- Average 1-year return for the category is +22.54%, average 3-year annualized return is +19.47%
- The category has high and above average volatility ratings as well as high and above average value ratings
- The category is tilited towards large-cap value names and its top country sector exposure is the U.S. (85.30%)
- The average return on equity for the category is 19.6% and the average price/ earnings (TTM) is 11.17