ETF Action: Research
Stay Ahead Of Market Trends.
Put ETF Action's powerful expert insights to work for you, including:

All Research Archives
Daily Note
4.25.2024
Disruptive Tech Category Report
4.25.2024
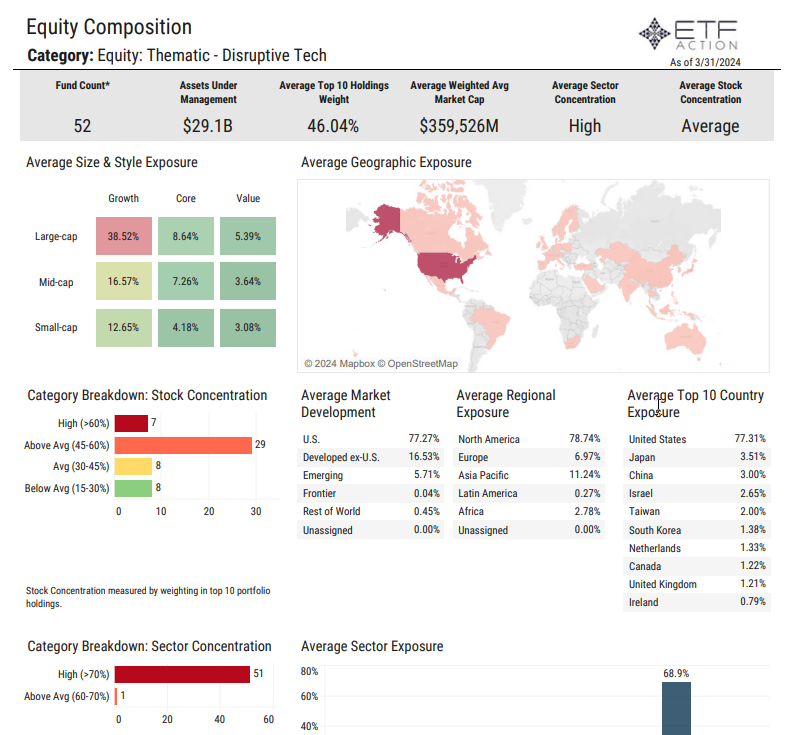
- The Equity: Thematic - Disruptive Tech category is comprised of 52 ETFs with $29.1 billion in total assets under management
- 6 of the ETFs in the category have more than $1 billion in AUM, the First Trust NASDAQ Cybersecurity ETF (CIBR) is the largest ETF at $6.6 billion
- 6 ETFs in the category have average daily volume higher than $10 million while 24 ETFs have ADV below $500K
- The average expense ratio is 56 bps, the average lifespan is 5.64 years, and the average TTM yield is 0.76%
- Industrials ETFs gathered $120 million in net inflows in March. The Global X Artificial Intelligence & Technology ETF (AIQ)gathered $250 million in net inflows while CIBR saw $56 million in net outflows on the month
- March performance was split: 32 ETFs posted gains while 20 ETFs posted losses, average 1-month reutrn was +0.32% and average 1-year return was +30.59%
- The Clockwise Core Equity & Innovation ETF (TIME) was the best performer of the group in March, up 4.26%
- The WisdomTree Cybersecurity Fund (WCBR) lagged in March, sinking 5.91%
- The category average exposure tilts towards Large-cap Growth (38%), U.S. exposure (78%), and the tech sector (69%).
- The category shows most funds have high groqwth ratings, below average value ratings, and average quality ratings.
Daily Note
4.24.2024
As investors digested the latest batch of corporate earnings results, the rally continued for U.S. equity markets on Tuesday. Spotify surged more than 11% on the day after surpassing Wall Street’s Q1 estimates and issuing encouraging 2Q guidance. UPS gained 2.4% after the delivery giant surpassed expectations for earnings. GE Aerospace jumped more than 8.3% after beating earnings expectations and PepsiCo fell nearly 3% after reporting that recalls and a weaker lower-income consumer hurt demand in the U.S. After the close, Tesla missed estimates on the top and bottom lines and reported a 9% drop in revenue in the first quarter, the steepest year-over-year decline since 2012. Google parent company Alphabet and Microsoft round out the technology-heavy earnings week on Thursday. New home sales accelerated in March at a faster-than-expected pace as mortgage rates declined over the month, the Commerce Department reported Tuesday. Sales of single-family homes totaled 693K for the month, considerably higher than the downwardly revised 637K in February and better than the 669K estimate. After dipping in January, the median sales price jumped back up to $430,700, the highest level since August 2023. Durable Goods Orders data is due out on Wednesday.
Equities:
- The NASDAQ 100 (QQQ) led the way once again, increasing 1.49%, the S&P 500 (SPY) gained 1.19% and the Dow Jones Industrial Average (DIA) added 69 bps
- Small-Caps (IJR) rose 1.78% while Mid-Caps (IJH) climbed 1.21%
- Growth-oriented pockets of the markets outperformed on Tuesday with Pure Growth (RPG) jumping 2.25% and High Beta (SPHB), Momentum (SPMO), and Growth (SPYG) all climbing at least 1.60%
- All other factors finished higher with Quality (SPHQ) gaining 1.24% and Value (SPYV) advancing 73 bps
- Emerging Markets (EEM) added 82 bps, lifted by Thailand (THD, +1.79%), Mexico (EWW, +1.36%), South Africa (EZA, +1.36%), and China (MCHI, +1.29%)
- Developed ex-U.S. Markets (EFA) were up 1.09% on strength from the Netherlands (EWN, +2.04%), Germany (EWG, +1.81%), and Hong Kong (EWH, +1.73%)
Sectors:
- Materials (XLB) was the lone U.S. sector in negative territory yesterday, slipping 86 bps
- XLB was once again pulled lower by Metals & Mining (XME, -1.41%)
- Communication Services (XLC) and Technology (XLK) were both up around 1.50% while Industrials (XLI) rose 1.39% and Health Care (XLV) added 1.30%
- Consumer Discretionary (XLY, +1.19%) and Real Estate (XLRE, +91 bps) also saw strong returns
- XLRE received a boost from Homebuilders (XHB, +2.67%)
Themes:
- Another strong day for global themes as Advanced Materials (REMX, -14 bps) was the only segment to see losses
- Cannabis (MJ) popped 5.43% followed by Disruptive Tech (ARKW, +3.20%) and Multi-Theme (ARKK, +2.98%)
- Evolving Consumer (SOCL), Cloud Computing (SKYY), Mobile Payments (IPAY), FinTech (FINX), Online Retail (IBUY), Blockchain (BLOK), Clean Energy (PBW), Cyber Security (HACK), Connectivity (FIVG), and Space (UFO) all climbed more than 2%
- 3D Printing (PRNT, +88 bps) was the only was the only other segment to rise less than 1%
Commodities & Yields:
- Broad Commodities (DJP) added just 9 bps as Energy (DBE) rose 96 bps and Industrial Metals (DBB) sank 2.02%
- Natural Gas (UNG) jumped 2.6% and Copper (CPER) fell 1.57%
- The U.S. Dollar (UUP) declined 41 bps, U.S. Aggregate Bonds (AGG) increased 21 bps, and Preferred & Income Securities (PFF) climbed 97 bps
- At the close, the U.S. 2-Year Treasury Yield stood at 4.935% and the U.S. 10-Year Treasury Yield stood at 4.607%
Daily Note
4.23.2024
U.S. equity markets bounced back on Monday from another disappointing week last week as investors awaited key earnings reports and a slew of economic data due out this week. Chipmaker and artificial intelligence favorite Nvidia climbed 4.4% yesterday, after sinking nearly 14% last week, its worst since September 2022. Verizon declined almost 5% on the day after missing revenue expectations and reported continued customer losses. Tesla earnings will be released tomorrow, along with results from UPS, Lockheed Martin, Invesco, Visa, Pepsi, and Spotify, amongst other companies. Meta Platforms, Microsoft, and Alphabet are all set to report earnings later this week. The New Home Sales report will also be released on Tuesday followed by an update on U.S. GDP on Thursday, and the Personal Consumption Expenditures (PCE) report on Friday.
Equities:
- The NASDAQ 100 (QQQ) rose 1.01% and exited oversold territory, the S&P 500 (SPY) gained 92 bps, and the Dow Jones Industrial Average (DIA) added 68 bps
- Mid-Caps (IJH) also jumped 1.03% while Small-Caps (IJR) increased 86 bps
- All U.S. factor strategies saw gains yesterday, Momentum (SPMO), High Beta (SPHB), Pure Value (RPV), Enhanced Value (SPVU), and Quality (SPHQ) all increased more than 1%
- Developed ex-U.S. Markets (EFA) and Emerging Markets (EEM) advanced 1.17% and 1.08%, respectively
- EFA was lifted by South Korea (EWY, +2.22%) and Hong Kong (EWH, +1.97%)
- EEM benefitted from solid returns from Vietnam (VNM, +2.62%) and China (MCHI, +1.98%)
Sectors:
- All U.S. sectors finished higher on Monday, led by Financials (XLF, +1.21%)
- XLF was bolstered by Regional Banks (KRE, +1.82%) and Banks (KBE, +1.71%)
- Consumer Staples (XLP), Utilities (XLU), and Technology (XLK) were all up around 90 bps, Real Estate (XLRE) and Industrials (XLI) gained around 80 bps
- Materials (XLB) lagged, adding just 10 bps. XLB was impacted by Metals & Mining (XME), which slipped 90 bps
- XLRE, XLK, and Consumer Discretionary (XLY) exited oversold territory
Themes:
- Just 3 global thematic segments were in the red yesterday: Cannabis (MJ, -1.34%), Advanced Materials (REMX, -90 bps), and Space (UFO, -33 bps)
- Blockchain (BLOK) was the best performing segment, jumping 3.84%
- FinTech (FINX) was up 2%, eSports & Video Games (ESPO), Disruptive Tech (ARKW), Mobile Payments (IPAY), and Multi-Theme (ARKK) were all up more than 1.40%
- Evolving Consumer (SOCL, +1.33%), Genomics (ARKG, +1.29%), and Cloud Computing (SKYY, +1.24%) were also strong
- The Valkyrie Bitcoin Miners ETF (WGMI) and the VanEck Digital Transformation ETF (DAPP) each surged more than 10% on the day
Commodities & Yields:
- Broad Commodities (DJP) dipped 12 bps, pulled lower by Precious Metals (DBP, -2.98%) and Agriculture (DBA, -1.21%)
- Silver (SLV) sank 4.85% and Gold (GLD) slipped 2.47% while Wheat (WEAT) and Natural Gas (UNG) both gained more than 3.5%
- U.S. Aggregate Bonds (AGG) added 6 bps, Preferred Income & Securities (PFF) rose 49 bps, and the U.S. Dollar (UUP) inched higher by 3 bps
- At the close, the U.S. 2-Year Treasury Yield stood at 4.971% and the U.S. 10-Year Treasury Yield stood at 4.613%
Global Large Cap Blend Category Report
4.23.2024
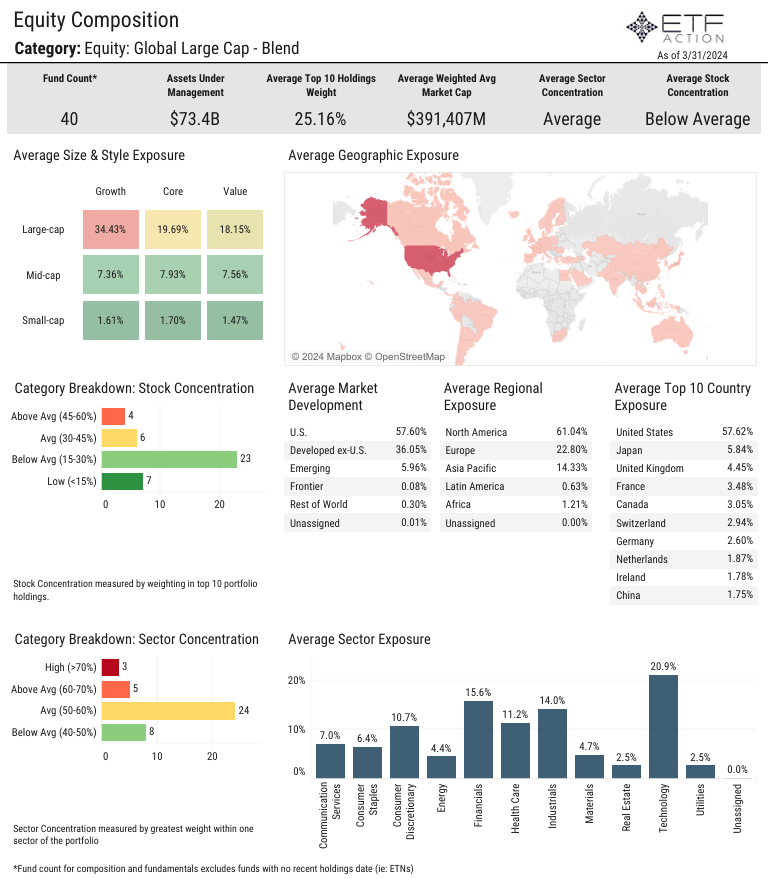
- The Equity: Global Large Cap - Blend category is made up of 40 ETf with $73.4 billion in total assets under management
- The Vanguar Total World Stock ETF (VT) and the iShares MSCI ACWI ETF (ACWI) are the largest ETFs in the category with $35.9 AUM and $19.6 billion AUM, respectively
- Notably, VT's expense ratio is 7 bps versus 32 bps for ACWI
- The average expense ratio of the category is 50 bps, the average lifespan is 5.88 years, and the average TTM yield is 1.24%
- 25 ETFs in the category have average daily volume below $500K, ACWI's ADV stands at $392.79 million, the highest in the category
- The category saw $610 million in net inflows in March and has gathered $2.63 billion in net inflows year-to-date
- VT saw the largest net inflows in the past 3 months with $1.5 billion
- All ETFs in the category posted gains in March, average 1-month return was +3.18% and average YTD return was +7.62%
- The Innovator Gradient Tactical Rotation Strategy ETF (IGTR) was the best performer last month, rising 6.23%, IGTR is up nearly 16% YTD
- The category is heavily tilted towards large cap growth names (34.43%) but has below average stock concentration
- The highest average sector exposure is Technology (20.9%) followed by Financials (15.6%)
Industrials Category Report
4.22.2024
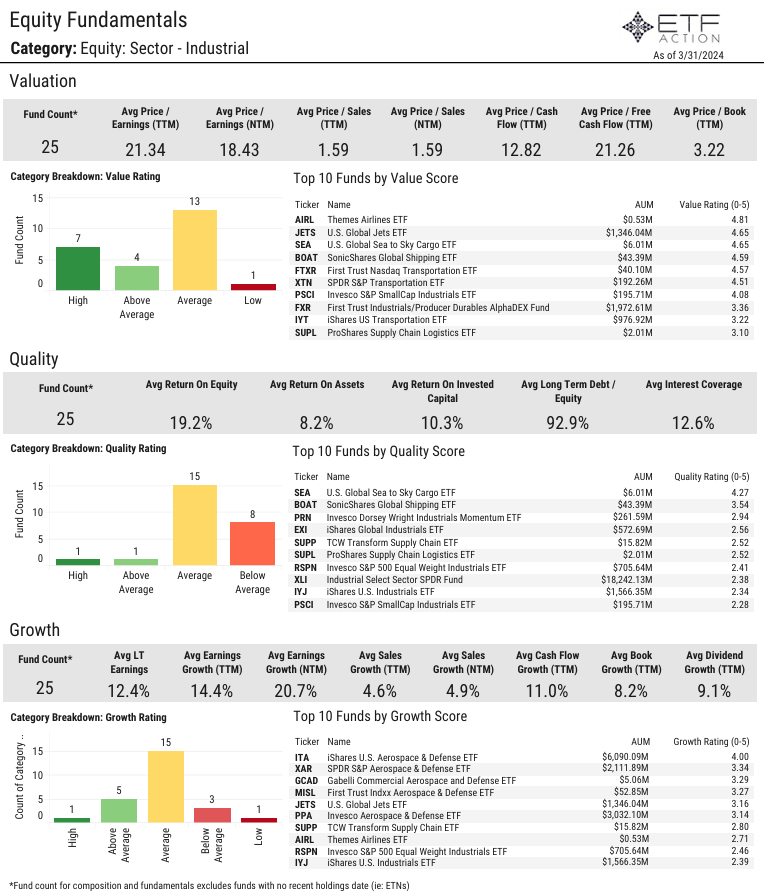
- The Equity: Sector - Industrial category is comprised of 25 ETFs with $43.8 billion in total assets under management
- 9 of the ETFs in the category have more than $1 billion in AUM, the Industrial Select Sector SPDR Fund (XLI) is the largest ETF at $18.2 billion
- 7 ETFs in the category have average daily volume higher than $10 million while 9 ETFs have ADV below $500K
- The average expense ratio is 45 bps, the average lifespan is 11.28 years, and the average TTM yield is 1.62%
- Industrials ETFs gathered $870 million in net inflows in March, XLI gathered $714.1 million in net inflows while the U.S. Global Jets ETF (JETS) saw $105.5 million in net outflows on the month
- Just 3 ETFs in the category posted losses last month, average 1-month reutrn was +3.13% and average 1-year return was +23.89%
- The SonicShares Global Shipping ETF (BOAT) lagged in March, sinking 2.49%
- The Invesco Aerospace & Defense ETF (PPA) has the highest sharpe ratio (3-year) relative to the iShares MSCI ACWI ETF (ACWI)
- The category is relatively diverse from a size and style perspective, average exposure to Europe at 9.05%
- The average price to earnings TTM is 21.34%, average return on equity is 19.2%, and the average dividend growth (TTM) is 9.1%
Daily Note
4.21.2024
The losing streak continued for the NASDAQ 100 (QQQ) and the S&P 500 (SPY) on Friday as Nvidia plunged 10% and Netflix declined more than 9%. QQQ and SPY both finished lower last week. The Dow Jones Industrial Average (DIA) saw positive returns on Friday and for last week. DIA was lifted by American Express, which jumped more than 5% following stronger-than-expected earnings results. Super Micro Computer, another semiconductor name, plummeted more than 20% on Friday, a sign that investors were rotating heavily out of the sector that led the recent bull market. Chicago Federal Reserve President Austan Goolsbee said Friday that inflation progress has “stalled,” meaning policymakers likely will have to be patient before cutting interest rates. According to the CME FedWatch Tool, there is a 3.2% probability of a rate cut at the May FOMC meeting and a 16.6% probability of a rate cut at the July meeting. This week, investors will be looking towards New Home Sales data, Durable Goods Orders figures, an update on U.S. GDP, Pending Home Sales data, and the Personal Consumption Expenditures (PCE) report.
Equities:
- On Friday, QQQ fell 2.07%, SPY sank 87 bps, and DIA added 57 bps
- QQQ and SPY were down 5.39% and 3.07%, respectively, last week while DIA inched higher by 3 bps
- QQQ entered oversold territory, all three major averages trading below relative 50-day moving averages but above relative 200-day moving averages
- Pure Value (RPV), Dividend (SPYD), and Low Volatility (SPLV) were all up more than 1% on Friday, Momentum (SPMO), Pure Growth (RPG), and Growth (SPYG) all slipped more than 2%
- Most factors were in the red last week, SPMO, RPG, and SPYG all declined more than 5%
- RPG is the only factor strategy sitting in oversold territory
- Developed ex-U.S. Markets (EFA) added 4 bps on Friday with Switzerland (EWL) climbing 1.15%
- Emerging Markets (EEM, 40 bps) were pulled lower by Taiwan (EWT, -2.10%) and Thailand (THD, -1.63%)
- EFA dipped 2.02% and EEM dropped 1.45% for the week
Sectors:
- Technology (XLK, -2.06%) underperformed once again on Friday, dragged lower by Semiconductors (XSD, -3.13%)
- Communication Services (XLC) fell 1.10% and Consumer Discretionary (XLY) slipped 88 bps
- Utilities (XLU, +1.54%), Financials (XLF, +1.38%), Energy (XLE, +1.20%), and Consumer Staples (XLP, +98 bps) were the top performers on the day
- XLF was boosted by Regional Banks (KRE, +2.62%) and Banks (KBE, +2.33%)
- Most sectors saw losses last week, XLK was down 6.27% and XLY dropped 4.15%
- XLU and XLP each gained more than 1% for the week
- XLK, XLY, and Real Estate (XLRE) all sit in oversold territory
Themes:
- Most global thematic segments posted negative returns on Friday
- Big Data (AIQ), Connectivity (FIVG), Disruptive Tech (ARKW), and Multi-Theme (ARKK) all sank more than 2%
- 3D Printing (PRNT) rose 92 bps and Digital Infrastructure (SRVR) added 81 bps
- All segments declined more than 1% last week with most dropping more than 3%
- Genomics (ARKG) and ARKK both plunged nearly 10% while Clean Energy (PBW) fell 8.74%
- 13 of the 28 segments sit in oversold territory, PBW and Solar (TAN) trading at 52-week lows
Commodities & Yields:
- Broad Commodities (DJP) climbed 1.05% on Friday, lifted by Copper (CPER, +1.15%) and Agriculture (DBA, +2.24%)
- Industrial Metals (DBB) have jumped 13.55% in the past month and DBA has risen 12.57%
- The U.S. Dollar (UUP) was flat on Friday, U.S. Aggregate Bonds (AGG) added 10 bps, and Preferred & Income Securities (PFF) gained 59 bps
- At Friday’s close, the U.S. 2-Year Treasury Yield stood at 4.990% and the U.S. 10-Year Treasury Yield stood at 4.647%
Daily Note
4.19.2024
Mixed session for U.S. equity markets on Thursday as treasury yields moved higher once again. The U.S. 2-Year jumped up back near 5% and the U.S. 10-Year rose close to 4.65% intraday yesterday. On the economic front, the Philadelphia Federal Reserve’s manufacturing index rose to 15.5 for the month, up more than 12 points from March and better than 2.5 estimate. Initial filings for unemployment claims held steady at 212K for the week ended April 13, indicating that companies remain reluctant to lay off workers. Existing home sales fell 4.3% on the month to a seasonally adjusted rate of 4.19 million, compared to the estimates for a decline of 4.8% and a total level of 4.17 million. The median existing home price jumped to $393,500 and inventory increased 1.11 million to the equivalent of 3.2 months of supply. Netflix topped quarterly earnings and revenue estimates and announced it will no longer report quarterly membership numbers or average revenue per user starting next year. Total memberships rose 16% in the first quarter, reaching 269.6 million, well above expectations.
Equities:
- The NASDAQ 100 (QQQ) and the S&P 500 (SPY) fell 57 bps and 21 bps, respectively, while the Dow Jones Industrial Average (DIA) added 10 bps
- 5th consecutive losing session for SPY
- All 3 major averages on pace for another losing week this week
- Growth-oriented pockets of the markets lagged yet again, S&P 500 Pure Growth (RPG, -67 bps), S&P 500 Momentum (SPMO, -60 bps), and S&P 500 Growth (SPYG, -51 bps)
- S&P 500 Pure Value (RPV) and S&P 500 Dividend (SPYD) both advanced 42 bps
- Emerging Markets (EEM) rose 40 bps on strength from China (MCHI, +1.28%)
- Developed ex-U.S. Markets (EFA, -27 bps) dragged lower by Australia (EWA, -85 bps) and the Netherlands (EWN, -63 bps)
Sectors:
- Technology (XLK, -1.14%) was the worst performing U.S. sector for the 2nd consecutive session, impacted by Semiconductors (XSD, -1.99%)
- Consumer Discretionary (XLY) declined 62 bps, Industrials (XLI) and Energy (XLE) each dropped more than 30 bps
- Utilities (XLU), Communication Services (XLC), and Consumer Staples (XLP) all climbed around 50 bps, Financials (XLF) also added 35 bps
- Real Estate (XLRE) and Health Care (XLV) remain in oversold territory
Themes:
- Another mixed session for global thematic themes yesterday, Evolving Consumer (SOCL, +2.07%) and Cannabis (MJ, +1.06%) were top performers
- Clean Energy (PBW) sank 2.05% to fresh 52-week lows
- Advanced Materials (REMX), Biotech (SBIO), and Solar (TAN) all dropped at least 1%
- TAN also hit new 52-week lows and is nearing oversold territory
Commodities & Yields:
- U.S. Aggregate Bonds (AGG, -28 bps), 20+ Year Treasury Bonds (TLT, -50 bps), U.S. Dollar (UUP, +21 bps)
- At the close, the U.S. 2-Year Treasury Yield stood at 4.988% and the U.S. 10-Year Treasury Yield stood at 4.637%.
- Broad Commodities (DJP) dipped 4 bps despite solid returns from Agriculture (DBA, +2.05%) and Industrial Metals (DBB, +1.36%)
Daily Note
4.18.2024
Equities: U.S. equity markets finished lower yesterday with the NASDAQ 100 (QQQ) declining 1.22%, the S&P 500 (SPY) falling 59 bps, and the Dow Jones Industrial Average (DIA) dipping 14 bps. All three major average are approaching oversold territory and are now trading more than 2% below relative 50-day moving averages. Mid-Caps (IJH) and Small-Caps (IJR) also dropped more than 80 bps. According to the latest Beige Book report filed Wednesday, the U.S. economy grew “slightly” over the past six weeks while price increases moved at a “modest” pace and employment showed “slight” gains as well. The Federal Reserve also noted that consumer spending “barely increased”, that home sales “strengthened” across most areas, and characterized the economic outlook as “cautiously optimistic.” Earnings wise, United Airlines surged more than 17% on the day after posting a narrower-than-expected loss and beating on revenue while J.B. Hunt Transport Services dropped more than 8% after missing analysts’ expectations on the top and bottom lines. Existing Home Sales figures and Jobless Claims data will be released on Thursday along with a slew of speeches from Federal Reserve officials.
U.S. factor strategies were mixed on Wednesday. S&P 500 High Dividend Low Volatility (SPHD) was up 62 bps while S&P 500 Dividend (SPYD) and S&P 500 Pure Value (RPV) rose around 50 bps. Growth-oriented pockets of the markets lagged once again with S&P 500 Pure Growth (RPG) sinking 1.37% and S&P 500 Momentum (SPMO) declining 1.22%. S&P 500 Growth (SPYG) also dipped 97 bps and S&P 500 Quality (SPHQ) slipped 95 bps. Developed ex-U.S. Markets (EFA) added 7 bps, buoyed by Australia (EWA, +1.12%). The Netherlands (EWN) and Japan (EWJ) both sank more than 1%. Emerging Markets (EEM, -8 bps) were pulled lower by Thailand (THD, -1.42%).
Sectors: Just 4 of the 11 U.S. sectors registered positive returns yesterday with Utilities (XLU) popping 2.09%. Consumer Staples (XLP) rose 37 bps while Financials (XLF) and Materials (XLB) both increased just over 20 bps. Technology (XLK) underperformed, falling 1.44% on weakness from Semiconductors (XSD, -2.18%). Real Estate (XLRE) also declined 83 bps, Consumer Discretionary (XLY) dropped 48 bps, and Energy (XLE) sank 29 bps. Health Care (XLV, -17 bps) and Communication Services (XLC, 9 bps) saw modest losses on the day. XLU and XLE are the only sectors trading above relative 50-day and 200-day moving averages.
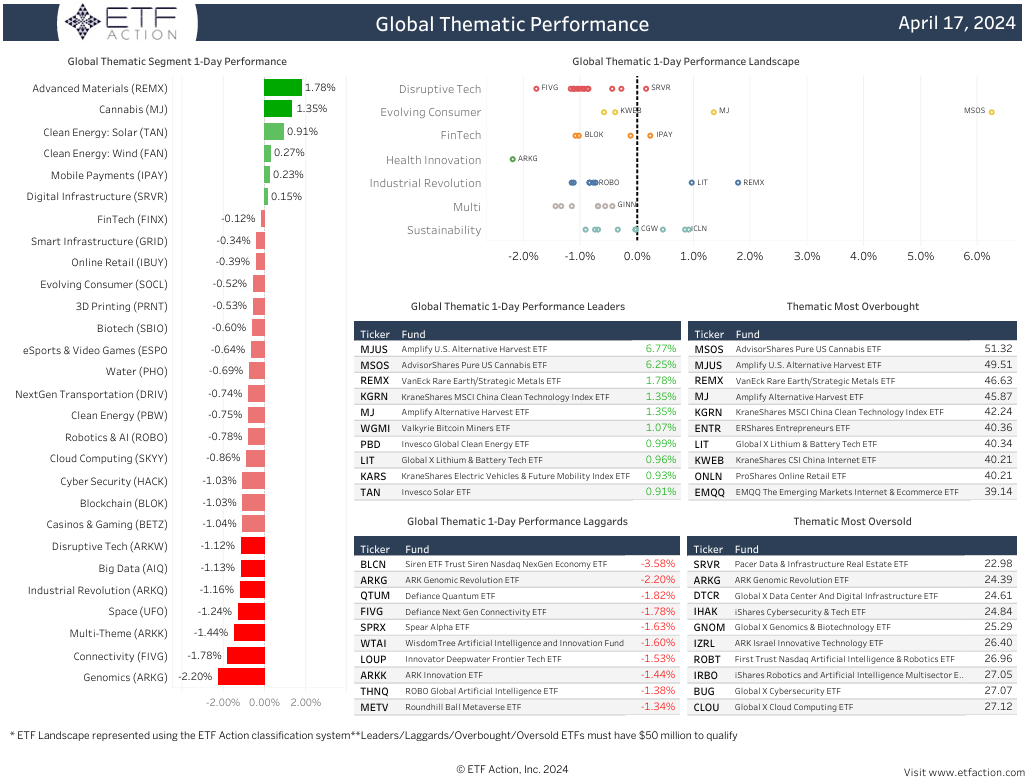
Themes: Most global thematic segments were in negative territory on Wednesday with Genomics (ARKG, -2.20%) falling the furthest. Connectivity (FIVG), Multi-Theme (ARKK), Space (UFO), Industrial Revolution (ARKQ), Big Data (AIQ), Disruptive Tech (ARKW), Casinos & Gaming (BETZ), Blockchain (BLOK), and Cyber Security (HACK) were all down more than 1%. Advanced Materials (REMX) and Cannabis (MJ) were the best performing segments, climbing 1.78% and 1.35%, respectively. Solar (TAN, +91 bps) also rose off 52-week highs. The Amplify U.S. Alternative Harvest ETF (MJUS) and the AdvisorShares Pure US Cannabis ETF (MSOS) both jumped more than 6% on the day.
Commodities & Yields: At yesterday’s close, the U.S. 2-Year Treasury Yield stood at 4.932% and the U.S. 10-Year Treasury Yield stood at 4.859%. The U.S. Dollar (UUP) slipped 31 bps, U.S. Aggregate Bonds (AGG) increased 46 bps, and 20+ Year Treasury Bonds gained 1.11%. Broad Commodities (DJP, -77 bps) were pulled lower by Energy (DBE), which sank 2.65%. WTI Crude Oil (USO) and Gasoline (UGA) were both down around 3%. Agriculture (DBA) and Industrial Metals (DBB) were both up around 1.30%.
Fixed Income - Taxable High Yield Category Report
4.18.2024
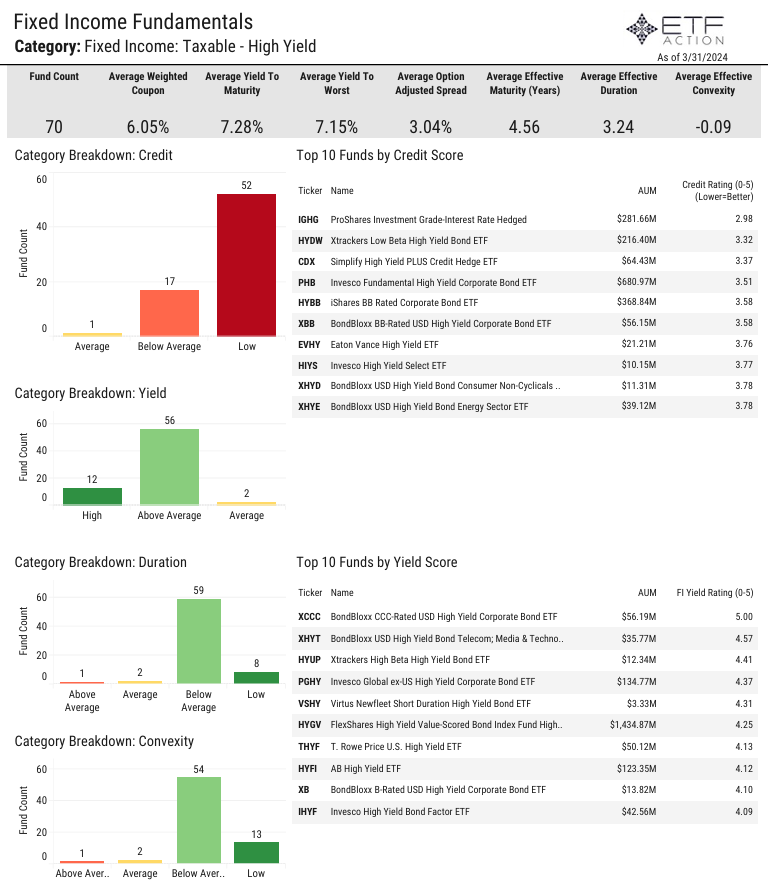
- There are 70 ETFs categorized as Fixed Income: Taxable - High Yield, total assets under management for the category is $72.4 billion
- The iShares iBoxx $ High Yield Corporate Bond ETF (HYG) is the largest ETF in the category with $16.9 billion in AUM and has the highest average daily volume at $2.8 billion
- 35 ETFs in the cateogry have ADV below $500K, average ADV for the category is $55.87 million
- The average expense ratio is 40 bps, the average lifespan is 5.87 years, and the average TTM yield is 5.45%
- The category has seen $1.15 billion in net inflows year-to-date, HYG has seen $2.1 billion in net outflows thus far in 2024
- All ETFs in the category were positive in March, average 1-month return was +1.15% and average 1-year return was +10.63%
- The BondBloxx CCC-Rated USD High Yield Corporate Bond ETF (XCCC) has the highest yield rating in the cateogry
- Average weighted coupon is 6.05%, average yield to maturity is 7.28%, and average effective maturity is 4.56 years
Industrial Revolution Category Report
4.17.2024
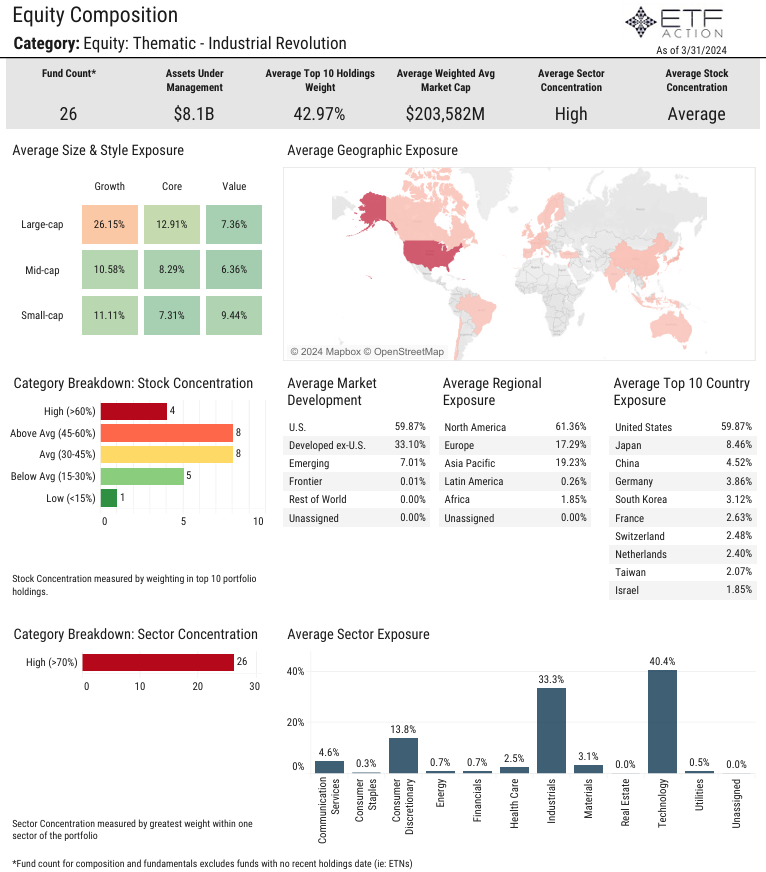
- The Equity: Thematic - Industrial Revolution category is made up of 26 ETFs with $8.1 billion in total assets under management
- Just 2 ETFs in the category have over $1 billion in AUM: the Global X Robotics & Artificial Intelligence ETF (BOTZ) with $2.9 billion and the ROBO Global Robotics & Automation Index ETF (BOTZ) with $1.4 billion
- The average expense ratio of the category is 59 bps, the average lifespan is 5.23 years, and the average TTM yield is 0.76%
- 14 Industrial Revolution ETFs have average daily volume below $500K, average ADV for the cateogry is $2.61 million
- BOTZ has the largest ADV at $37.5 million
- The category has seen modest net outflows thus far in 2024 but has gathered $620 million in net inflows over the past year
- BOTZ has gathered $645 million in net inflows in the last year while the Global X Autonomous & Electric Vehicles ETF (DRIV) has seen $291.9 million in net outflows
- 21 of the 26 ETFs in the category registered positive returns in March, average 1-month return was +1.72% and average 1-year return was +9.38%
- The Global X Defense Tech ETF (SHLD) jumped more than 6% last month
- The category is heavily tilted to Large Cap Growth names but is relatively diverse from a regional exporsure perspective
- Industrial Revolution ETFs have high average sector exposre to Technology (40.4%) and Industrials (33.3%)
Daily Note
4.17.2024
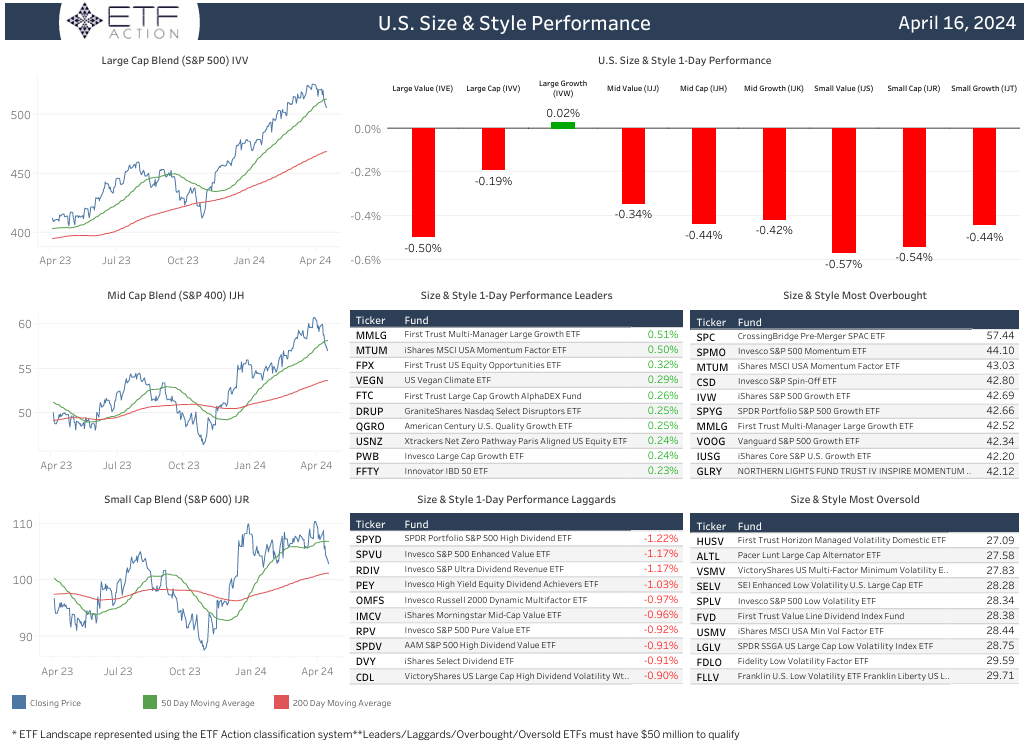
Equities: Mixed session for U.S. equity markets on Tuesday as investors digested fresh commentary from Federal Reserve Chairman Jerome Powell. The Dow Jones Industrial Average (DIA) advanced 18 bps and the NASDAQ 100 (QQQ) added 1 bps while the S&P 500 (SPY) declined 18 bps. Powell stated yesterday that the U.S. economy, while otherwise strong, has not seen inflation come back to the central bank’s goal, pointing to the further likelihood that interest rates will not be cut any time soon. Since July 2023, the Fed has kept its benchmark interest rate in a target range between 5.25%-5.5%, the highest in 23 years. That was the result of 11 consecutive rate hikes that began in March 2022. The U.S. 2-Year spiked above 5.0% and the U.S. 10-Year jumped near 4.70% intraday following the remarks. In other economic news, industrial production rose 0.4% in March but fell 1.8% in Q1 while housing starts and building permits both missed expectations. On the earnings front, Morgan Stanley posted stronger-than-expected earnings and revenue results while Bank of America reported that profit fell 18% from the previous year and revenue slipped 1.6%. Johnson & Johnson reported mixed results and UnitedHealth handily topped revenue expectations for the quarter. Investors will be looking towards the release of the Beige Book on Wednesday in addition to a handful of speeches from Fed officials.
Just 3 U.S. factor strategies were in the green yesterday: S&P 500 Pure Growth (RPG, +17 bps), S&P 500 Growth (SPYG, +3 bps), and S&P 500 Quality (SPHQ, +2 bps). S&P 500 Dividend (SPYD) and S&P 500 Enhanced Value (SPVU) both around 1.20% while S&P 500 Pure Value (RPV) decreased 92 bps. Emerging Markets (EEM, -1.32%) were dragged lower by Indonesia (EIDO, -2.93%), Mexico (EWW, -2.51%), Brazil (EWZ, -2.37%), and Taiwan (EWT, -2.27%). Developed ex-U.S. Markets (EFA) tumbled 99 bps on weakness from Australia (EWA, -2.06%), Hong Kong (EWH, -1.87%), and South Korea (EWY, -1.56%). EFA and EEM are approaching oversold territory.
Sectors: Real Estate (XLRE) underperformed other U.S. sectors once again on Tuesday, slipping 1.53%. XLRE entered oversold territory and has fallen 7% in the past month. Utilities (XLU) declined 1.32%, Energy (XLE) dropped 87 bps, and Materials (XLB) slid 77 bps. Financials (XLF, -68 bps) and Consumer Discretionary (XLY, -57 bps) were also weak. XLF was impacted by Banks (KBE) and Regional Banks (KRE), which both decreased more than 1.25%. Technology (XLK) gained 12 bps. Consumer Staples (XLP) and Health Care (XLV) were the only other sectors in positive territory on the day, each adding 4 bps.
Themes: Global themes continued to lag broader markets yesterday with just 3 segments posting modest gains: eSports & Video Games (ESPO, +13 bps), Cloud Computing (SKYY, +12 bps), and Connectivity (FIVG, +12 bps). Genomics (ARKG) and Advanced Materials (REMX) were the worst performing segments, slipping 3.17% and 2.94%, respectively. Solar (TAN, -2.12%) and Clean Energy (PBW, -1.81%) each hit fresh 52-week lows while Digital Infrastructure (SRVR, -1.78%) continued to fall further into oversold territory and Multi-Theme (ARKK) declined 1.64%. Cannabis (MJ) is the only segment trading above its 50-day moving average.
Commodities & Yields: Broad Commodities (DJP) fell 40 bps on Tuesday as Agriculture (DBA) tumbled 2.30% and Industrial Metals (DBB) dropped 91 bps. Soybean (SOYB), Sugar (CANE), and Copper (CPER) were all down more than 1% and Silver (SLV) decreased 2.31%. U.S. Aggregate Bonds (AGG) sank 28 bps, 20+ Year Treasury Bonds (TLT) retreated 66 bps, and the U.S. Dollar (UUP) added 14 bps. At yesterday’s closing bell, the U.S. 2-Year Treasury Yield stood at4.964% and the U.S. 10-Year Treasury Yield stood at 4.657%.
Emerging Markets Large Cap Category Report
4.16.2024
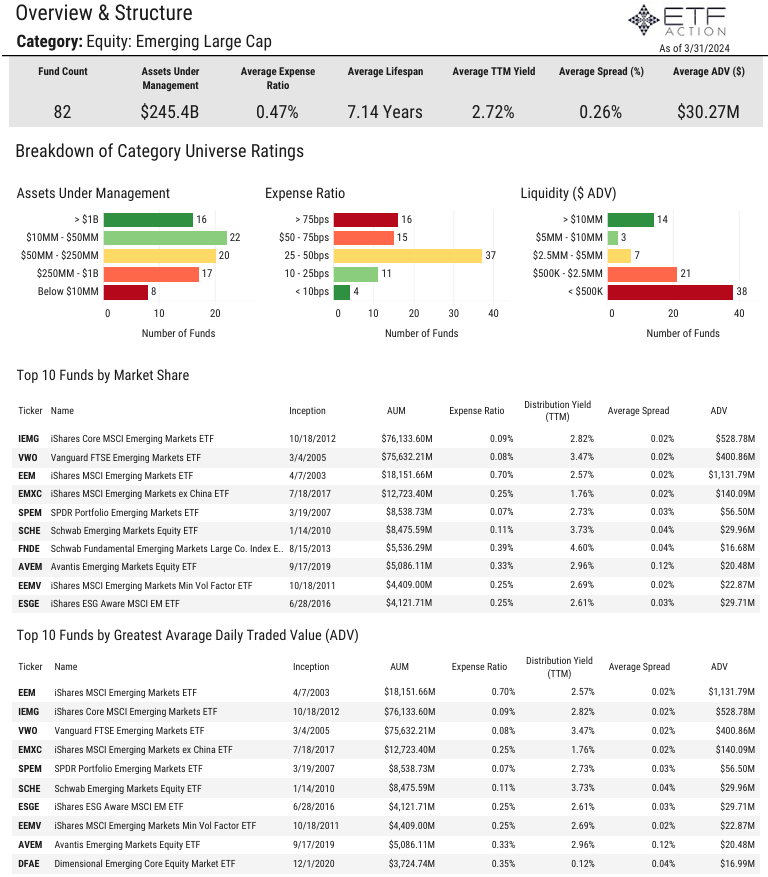
- The Equity: Emerging Large Cap category is made up ofo 82 ETFs with $245.5 billion in total assets under management
- 16 of the ETFs in the category have more than $1 billion in AUM, the largest is the iShares Core MSCI Emerging Markets ETF (IEMG) with $76.1 billion in AUM
- The average expense ratio is 47 bps but 16 ETFs have expense ratios above 75 bps
- The average lifespan is 7.14 years, the average TTM yield is 2.72%, and the average spread is 0.26%
- The average ADV is $30.27 million but 38 ETFs in the category have ADV below $500K
- Large Cap Emerging Market ETFs continue to see solid net inflows gathering $1.77 billion in March and $11.16 billion in the past year
- The iShares MSCI Emerging Markets ex China ETF (EMXC) saw the largest net inflows in March with $1.61 billion and has gathered more than $8.1 billion in the past year
- Just 4 ETFs in the category posted losses last month, average 1-month return was +2.12% and average 1-year return was +11.61%
- The SPDR S&P Emerging Markets Dividend ETF (EDIV) is the only ETF in the category with positve alpha (3-year) relative to the iShares MSCI ACWI ex U.S. ETF (ACWX)
- The largest average country exposures for the category are Taiwan (1841%), China (17.60%), and India (16.96%)
- The category has high average sector exposures to Financials (21.7%) and Technology (21.4%)
Daily Note
4.16.2024
Equities: After another losing week last week, U.S. equity markets continued to push lower on Monday with the NASDAQ 100 (QQQ) slipping 1.65%, the S&P 500 (SPY) falling 1.25%, and the Dow Jones Industrial Average (DIA) retreating 65 bps. Small-Caps (IJR) and Mid-Caps (IJH) were also down around 1%. Markets faced pressure from stubborn treasury yields that continue to rise. The U.S. 2-Year advanced above 4.95% while the U.S. 10-Year jumped above 4.65% intraday yesterday. The Commerce Department reported on Monday that retail sales increased 0.7% month-over-month in March, well above the +0.3% estimate but below the upwardly revised +0.9% February figure. Year-over-year, sales rose 4.0%. The results indicate that consumers more than kept up with the pace of inflation as the Consumer Price Index (CPI) increased 3.5% for the year. Separately, Salesforce declined more than 7% yesterday following reports that the software company was in talks to acquire data management firm Informatica. Goldman Sachs climbed almost 3% on the day after topping earnings and revenue expectations. Revenue jumped 16% from the previous year to $14.21 billion, topping analysts’ estimates by more than $1 billion. On Tuesday, Housing Starts & Permits data will be released and Fed Chair Jerome Powell is scheduled to speak.
Growth-oriented pockets of the markets underperformed yesterday with S&P 500 Growth (SPYG) sliding 1.79%, S&P 500 Pure Growth (RPG) dropping 1.66%, and S&P 500 Momentum (SPMO) declining 1.51%. All other U.S. factor strategies were also in the red. S&P 500 Enhanced Value (SPVU) dipped just 18 bps. Emerging Markets (EEM) decreased 64 bps as South Africa (EZA) fell 1.59%. Taiwan (EWT) and Brazil (EWZ) were both down 1.47% as well while Mexico (EWW) dipped 1.31%. Developed ex-U.S. Markets (EFA) sank 30 bps, pulled lower by Hong Kong (EWH, -1.39%) and Australia (EWA, -71 bps).
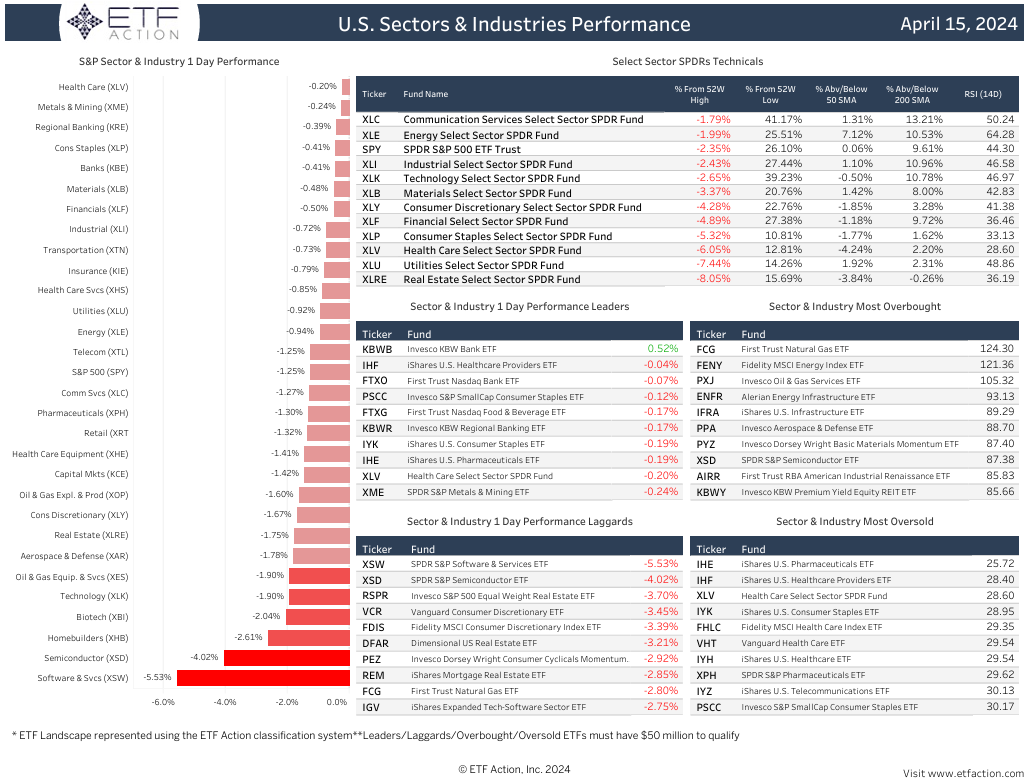
Sectors: Technology (XLK) and Real Estate (XLRE) were the worst performing U.S. sectors on Monday, sinking 1.90% and 1.75%, respectively. XLK was impacted by Software & Services (XSW, -5.53%) and Semiconductors (XSD, -4.02%) while XLRE was dragged lower by Homebuilders (XHB, -2.61%). XLRE is the only sector trading below its 50-day and 200-day moving average and is nearing oversold territory. Consumer Discretionary (XLY) also dropped 1.67% and Communication Services (XLC) slipped 1.27% while Energy (XLE) and Utilities (XLU) both fell more than 90 bps. Health Care (XLV) saw the best returns on the day, dipping 20 bps.
Themes: All global thematic segments finished in negative territory on Monday with most dropping more than 1.50%. Multi-Theme (ARKK, -4.58%) and Disruptive Tech (ARKW, -4.33%) fell the furthest. Blockchain (BLOK) was down 3.93%, Genomics (ARKG) declined 3.86%, and Solar (TAN) dipped 3.31%. TAN hit fresh 52-week lows while ARKG entered oversold territory, joining Digital Infrastructure (SRVR, -1.52%) and Space (UFO, -2.29%). Clean Energy (PBW) also decreased 2.66% to new 52-week lows. Online Retail (IBUY), Cyber Security (HACK), Cloud Computing (SKYY), and Industrial Revolution (ARKQ) were all down more than 2.35%. Water (PHO) dipped 61 bps and was the top performing segment.
Commodities & Yields: The U.S. Dollar (UUP) added 17 bps, U.S. Aggregate Bonds (AGG) declined 60 bps, and Preferred & Income Securities (PFF) dropped 1.71% yesterday. At Monday’s close, the U.S. 2-Year Treasury Yield stood at 4.938% and the U.S. 10-Year Treasury Yield stood at 4.606%. Broad Commodities (DJP) gained 59 bps, bolstered by Industrial Metals (DBB, +1.44%) and Precious Metals (DBP, +2.03%). Silver (SLV) added 3.04%, Gold (GLD) rose 1.87%, and Copper (CPER) jumped 2.40%. Natural Gas (UNG) fell 5.04%.
Daily Note
4.15.2024
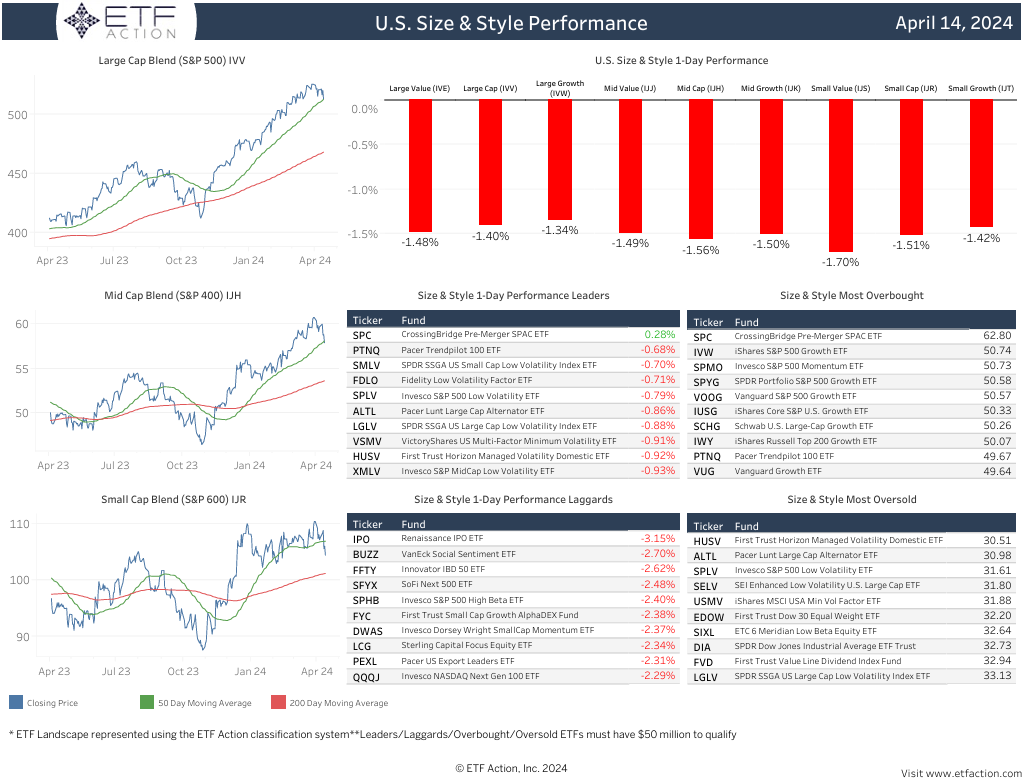
Equities: U.S. equity markets tumbled on Friday with the NASDAQ 100 (QQQ) slipping 1.59%, the S&P 500 (SPY) falling 1.38%, and the Dow Jones Industrial Average (DIA) declining 1.21%. All three major averages finished lower last week as DIA dropped 2.31%, SPY decreased 1.46%, and QQQ dipped 50 bps. Small-Caps (IJR) and Mid-Caps (IJH) were also down more than 1.50% on Friday and sank around 2.90% last week. JPMorgan Chase retreated more than 6% on Friday after reporting that net interest income, a key measure of what it makes through lending activities, could be a little short of what Wall Street analysts are expecting in 2024. CEO Jamie Dimon also warned about persistent inflationary pressures weighing on the economy. According to the University of Michigan’s consumer sentiment index, consumers are also growing worried about the persistent inflationary pressures. The index came in at 77.9 for April, which is below the 79.9 consensus estimate. Year-ahead and long-run inflation expectations also ticked up, reflecting frustrations over sticky inflation. This week, investors will be looking towards Retail Sales data, Housing Starts & Permits figures. The Industrial Production report, and Existing Home Sales results. Fed Chairman Jerome Powell will also speak on Tuesday.
All U.S. factor strategies were in the red on Friday and for last week. S&P 500 Low Volatility (SPLV, -79 bps) was the only factor to decline less than 1% On Friday while S&P 500 High Beta (SPHB) slid 2.40% and S&P 500 Pure Growth (RPG) dropped 2.04%. S&P 500 Pure Value (RPV) was the worst performing factor last week, slipping nearly 4%. Most factors were down more than 2% for the week. Developed ex-U.S. Markets (EFA) retreated 1.62% on Friday as South Korea (EWY) and Hong Kong (EWH) both sank more than 3%. Emerging Markets (EEM, -2.29%) were pulled lower by China (MCHI, -3.11%) and South Africa (EZA, -2.70%). EEM and EFA both fell around 2% last week.
Sectors: Utilities (XLU, -76 bps) was the only U.S. sector to sink less than 1% on Friday. Materials (XLB) saw the worst returns, slipping 1.77%. Communication Services (XLC), Energy (XLE, -1.63%), Consumer Discretionary (XLY), and Technology (XLK) all fell more than 1.60% while Health Care (XLV) dropped 1.49% and Financials (XLF) declined 1.33%. XLV was dragged lower by Biotech (XBI, 3.43%) and Pharmaceuticals (XPH, -3.00%). XLV also entered oversold territory and is now trading more than 4% below its 50-day moving average. All sectors posted losses last week with XLF, XLB, and XLV all decreasing more than 3%. XLK dipped just 50 bps on the week.
Themes: All global thematic segments were down more than 1% on Friday. Cannabis (MJ) underperformed, plunging 4.99%, while Advanced Materials (REMX) and Clean Energy (PBW) each declined more than 4%. PBW hit new 52-week lows. Solar (TAN), Blockchain (BLOK), Multi-Theme (ARKK), Genomics (ARKG), Disruptive Tech (ARKW), Biotech (SBIO), and 3D Printing (PRNT) all dropped more than 3% on the day. All segments were in negative territory last week. MJ plummeted more than 11% for the week and PBW, Casinos & Gaming (BETZ), and BLOK all fell more than 4%. Most segments have also seen negative returns in the past month with ARKG retreating more than 12%.
Commodities & Yields: The U.S. Dollar (UUP) rose 80 bps, U.S. Aggregate Bonds (AGG) added 19 bps, and 20+ Year Treasury Bonds (TLT) gained 53 bps on Friday. At the closing bell, the U.S. 2-Year Treasury Yield stood at 4.882% and the U.S. 10-Year Treasury Yield stood at 4.499%. Broad Commodities (DJP) dipped 2 bps on the day as Gold (GLD) fell 1.32%, Silver (SLV) dropped 1.46%, and Sugar (CANE) declined 2.30%. Corn (CORN) was also up 1.22%.
Health Care Category Report
4.15.2024
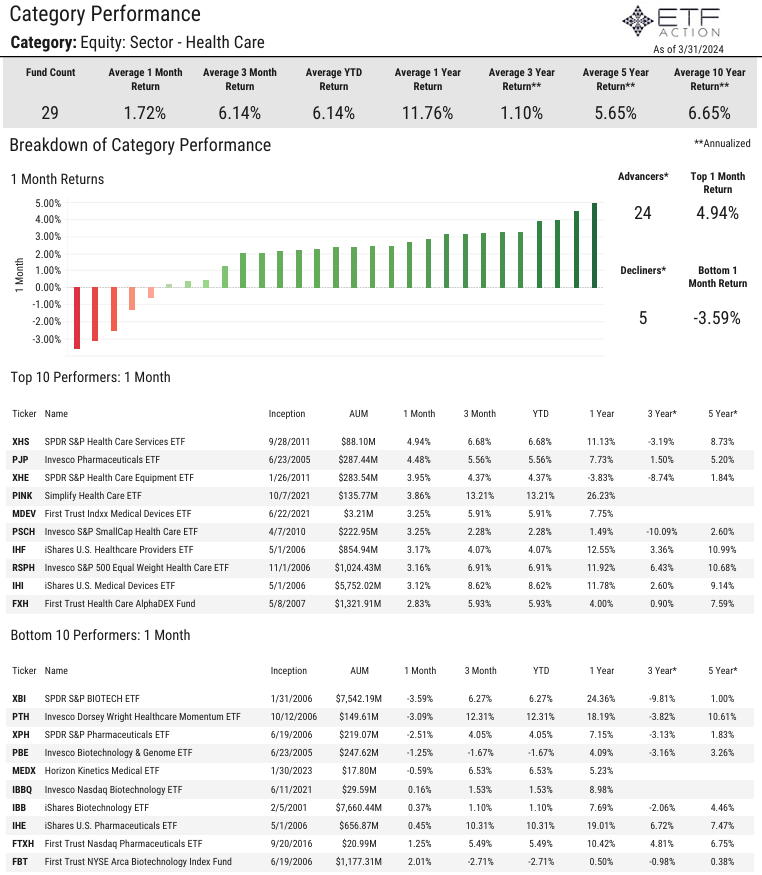
- The Equity: Sector - Health Care category is made up of 29 ETFs with $99.0 billion in total assets under management
- The Health Care Select Sector SPDR Fund (XLV) is the largest ETF in the category with $41.3 billion in AUM followed by the Vanguard Health Care ETF (VHT) with $18.2 billion in AUM
- The average expense ratio of the category is 44 bps, the average lifespan is 14.24 years, and the average TTM yield is 0.86%
- About half of the Health Care ETFs have low liquidity ratings, average daily volume for the category is $92.68 million
- XLV and the SPDR S&P Biotech ETF (XBI) are the only ETFs in the category with average daily volume above $1 billion
- Health Care ETFs saw $170 million in net outflows in March but have gathered $450 million in net inflows year-to-date
- The iShares U.S. Medical Devices ETF (IHI) gathered $85.6 million in net inflows last month while XLV saw $99.2 million in net outflows
- Most Health Care ETFs posted gains in March, average 1-month return was +1.72% and average YTD return was +6.14%
- The SPDR S&P Health Care Services ETF (XHS) and the Invesco Pharmaceuticals ETF (PJP) both climbed more than 4% on the month while XBI slid 3.59%
- The VanEck Pharmaceutical ETF (PPH) has the highest sharpe ratio (3-year) relative to the iShares MSCI ACWI ETF (ACWI) at 0.80
- Average up capture of the category is 66.32% and average down capture is 97.18%
- The category has high and above average stock concentration but is relatively diverse from a size and style perspective
- 25 of the 29 Health Care ETFs have high or above average growth ratings
- The Harbor Health Care ETF (MEDI) has the highest growth rating (4.09) while XHS has the highest value rating (4.02)
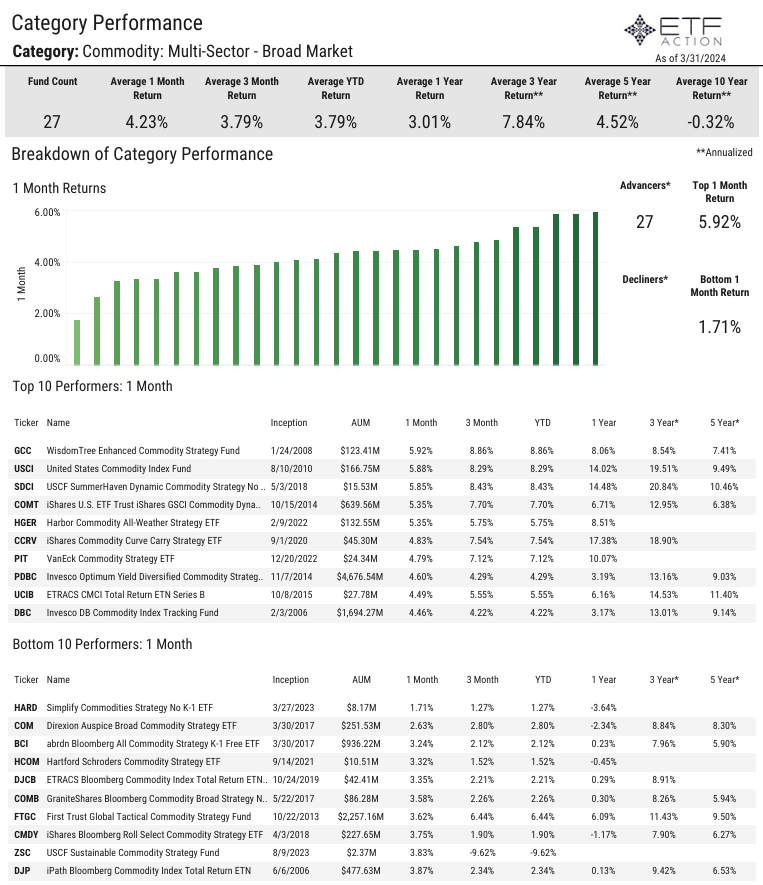
Broad Based Commodity Category Report
4.12.2024
- The Commodity: Multi-Sector - Broad Based category is comprised of 27 ETFs with $13.6 billion in total assets under management
- The average expense ratio of the category is 61 bps, the average lifespan is 6.96 years, and the average TTM yield is 2.82%
- Just 4 ETFs in the category have more than $1 billion in AUM, the Invesco Optimum Yield Diversified Commodity Strategy (PDBC) is the largest with $4.7 billion in AUM
- 7 ETFs in the category have an expense ratio above 75 bps
- 9 ETFs in the category have an average daily volume of less than $500K, average ADV is $4.14 million
- Multi-Sector Commodity ETFs have seen $430 million in net outflows year-to-date and $2.43 billion in net outflows over the last year
- PDBC has seen $763 million in net outflows in the last year
- Almost ETFs in the category registered positive returns in March, average 1-month return was +4.23% and average 3-month return was +3.79%
- The WisdomTree Enhanced Commodity Strategy Fund (GCC) was the best perfomer last month, rising 5.92%
Daily Note
4.12.2024
Equities: As investors digested March’s Producer Price Index (PPI) results, U.S. equity markets were higher on Thursday with the NASDAQ 100 (QQQ) climbing 1.60% to new 52-week highs and the S&P 500 (SPY) advancing 76 bps. The Dow Jones Industrial Average (DIA) inched higher by just 1 bps while Small-Caps (IJR) added 43 bps and Mid-Caps (IJH) rose 5 bps. The Labor Department reported yesterday that the PPI, a measure of inflation at the wholesale level, increased 0.2% for the month, less than the +0.3% consensus estimate. However, on a 12-month basis, the PPI rose 2.1%, the biggest gain since April 2023, indicating pipeline pressures that could keep inflation elevated. Excluding food and energy, the core PPI also rose 0.2% for the month and 2.4% for the year. Treasury yields were steady on Thursday with the U.S. 2-Year hovering around 4.95% and the U.S. 10-Year trading above 4.55% intraday. Separately, initial filings for jobless benefits dropped 11K from the previous week to 211K, which was below the 217K estimate. On Friday, investors will be looking towards Import & Export Prices figures along with Consumer Sentiment data. Several banks will report earnings Friday, including JPMorgan Chase, Wells Fargo, Citigroup, BlackRock, and State Street.
Most U.S. factor strategies saw negative returns yesterday with S&P 500 Value + Momentum (SPVM) dropping 96 bps. S&P 500 Enhanced Value (SPVU) and S&P 500 Low Volatility (SPLV) both slipped more than 80 bps. Growth-oriented pockets of the markets outperformed with S&P 500 Momentum (SPMO), S&P 500 Growth (SPYG), and S&P 500 Pure Growth (RPG) all gaining more than 1.40%. Emerging Markets (EEM) increased 61 bps as South Africa (EZA) jumped 1.40% and China (MCHI) rose 77 bps. Developed ex-U.S. Markets (EFA, +27 bps) were lifted by South Korea (EWY, +2.48%) and Japan (EWJ, +88 bps).
Sectors: Technology (XLK) surged 2.00% on Thursday and outpaced other U.S. sectors. XLK was bolstered by Semiconductors (XSD, +2.34%). Communication Services (XLC) and Consumer Discretionary (XLY) each climbed more than 80 bps while Industrials (XLI) and Real Estate (XLRE) each added 11 bps. XLC sits just 14 bps from new 52-week highs. Financials (XLF) lagged, falling 71 bps as Insurance (KIE) declined another 2.71%. Health Care (XLV) dropped 41 bps, Consumer Staples (XLP) sank 24 bps, and Utilities (XLU) retreated 20 bps. XLV continues to move closer to oversold territory.
Themes: Biotech (SBIO, +2.01%) was the top performing global thematic segment yesterday. Most segments were in the green with Connectivity (FIVG), Big Data (AIQ), Multi-Theme (ARKK), and Disruptive Tech (ARKW) all rising around 1.50%. Advanced Materials (REMX), Biotech (SBIO), Online Retail (IBUY), Industrial Revolution (ARKQ), and Cloud Computing (SKYY) were all up more than 1%. Cannabis (MJ) declined 99 bps on the day but is still up more than 25% over the past month. Solar (TAN) was down 66 bps while Clean Energy (PBW) and 3D Printing (PRNT) both sank around 30 bps.
Commodities & Yields: U.S. Aggregate Bonds (AGG) added 2 bps, 20+ Year Treasury Bonds (TLT) declined 45 bps, and the U.S. Dollar (UUP) increased 7 bps yesterday. At the closing bell, the U.S. 2-Year Treasury Yield stood at 4.965% and the U.S. 10-Year Treasury Yield stood at 4.593%. Broad Commodities (DJP) dropped 26 bps as Natural Gas (UING) slipped 5.23%, Gold (GLD) popped 1.94%, and Wheat (WEAT) decreased 1.48%.
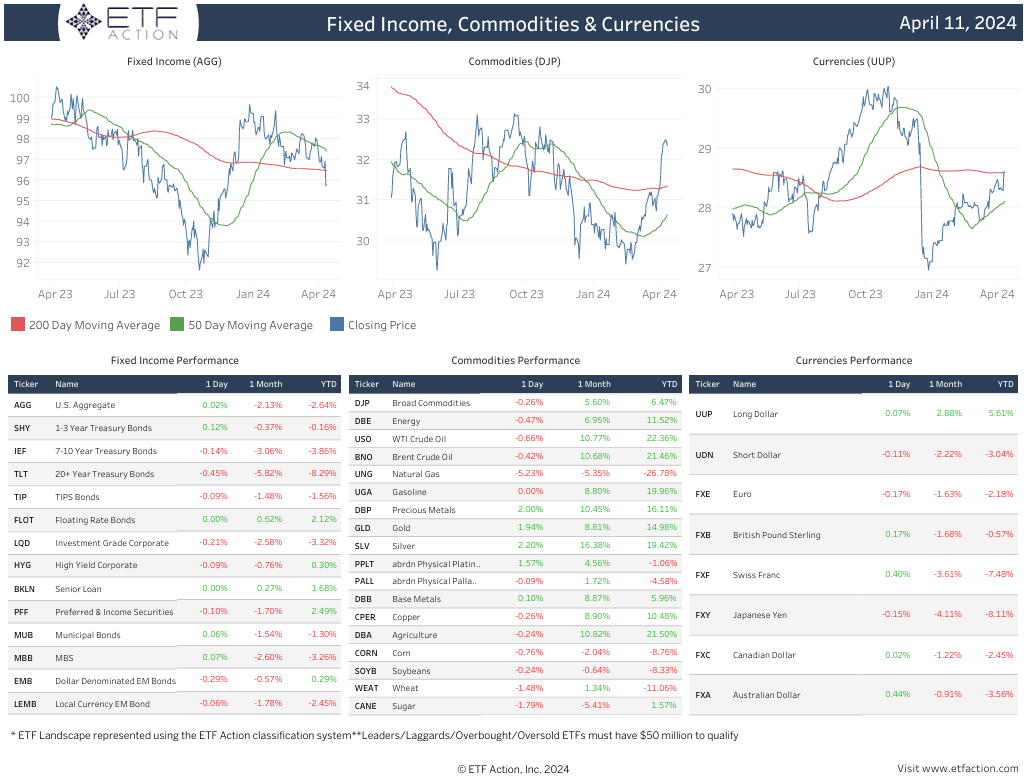
Daily Note
4.11.2024
Equities: Following a hotter-than-expected Consumer Price Index (CPI) report, equity markets finished sharply lower on Wednesday. The Dow Jones Industrial Average (DIA) declined 1.11%, the S&P 500 (SPY) fell 1.00%, and the NASDAQ 100 (QQQ) sank 87 bps. Mid-Caps (IJH) also dropped 2.03% while Small-Caps (IJR) retreated nearly 3%. The Labor Department reported yesterday that the core CPI rose 0.4% month-over-month and 3.5% year-over-year in March, bot figures were above estimates. Core CPI, which excludes volatile food and energy prices, increased 0.4% on the month and 3.8% for the year. Energy rose 1.1% last month after climbing 2.3% in February, while shelter costs, which make up about one third of the weighting in the CPI, were higher by 0.4% on the month and up 5.7% from a year ago. The U.S. 2-Year Treasury Yield jumped up near 5% and the U.S. 10-Year Treasury Yield surged above 4.55% intraday Wednesday after the results. The probability of a rate cut at the June meeting now stands at 19.5% and the probability of a rate cut at the July meeting now stands at 42.8%, according to the CME FedWatch Tool. The minutes for the March Federal Open Market Committee (FOMC) meeting were also released yesterday and indicated that officials remained uncertain about the persistence of high inflation. Several members expressed the view that recent data had not increased their confidence that inflation was moving sustainably down to 2%. All eyes will now be on Thursday’s Producer Price Index (PPI) report.
No U.S. factor strategies were in positive territory yesterday with most factors falling more than 1%. S&P 500 High Beta (SPHB) slumped 2.83%, S&P 500 Dividend (SPYD) dipped 2.66%, and S&P 500 Pure Value (RPV) dropped 2.05%. Developed ex-U.S. Markets (EFA) and Emerging Markets (EEM) were both down around 1.35% on the day. EFA was impacted by weakness from South Korea (EWY, -3.83%), Australia (EWA, -2.25%), and Japan (EWJ, -1.56%). EEM was pulled lower by Brazil (EWZ, -2.76%), South Africa (EZA, -2.50%), and Mexico (EWW, -1.96%).
Sectors: Energy (XLE) was the lone U.S. sector in the green on Wednesday, adding 31 bps. XLE was lifted by Oil & Gas Equipment & Services (XES, +67 bps) and Oil & Gas Exploration & Production (XOP, +34 bps), the only industries to see gains for the day. Real Estate (XLRE) plummeted 4.11% as Homebuilders (ITB) retreated 3.71%. Utilities (XLU) also declined 1.71% while Materials (XLB), Consumer Discretionary (XLY), and Financials (XLF) were all down around 1.50%. XLF was impacted by sizeable losses from Regional Banks (KRE, -4.96%) and Banks (KBE, -4.14%). Technology (XLK, -1.23%) and Health Care (XLV, -1.17%) also underperformed.
Themes: All global thematic segments posted losses yesterday with Genomics (ARKG, -4.54%) falling the furthest. Clean Energy (PBW), Solar (TAN), Digital Infrastructure (SRVR), and Cannabis (MJ) all declined more than 3% while Multi-Theme (ARKK), Casinos & Gaming (BETZ), FinTech (FINX), Industrial Revolution (ARKQ), Advanced Materials (REMX), Wind (FAN), NextGen Transportation (DRIV), and Online Retail (IBUY) all dropped more than 2%. Blockchain (BLOK) was the best performing segment of the day, adding 41 bps. SRVR and ARKG are approaching oversold territory.
Commodities & Yields: At Wednesday’s closing bell, the U.S. 2-Year Treasury Yield stood at 4.971% and the U.S. 10-Year Treasury Yield stood at 4.550%. The U.S. Dollar (UUP) popped 1.06%, U.S. Aggregate Bonds (AGG) dropped 1.20% and 20+ Year Treasury Bonds (TLT) fell 2.18%. Broad Commodities (DJP) dipped 15 bps yesterday as Natural Gas (UNG) sank 1.14%, Gold (GLD) declined 95 bps, and Sugar (CANE) decreased 70 bps. WTI Crude Oil (USO) was up more than 1%.
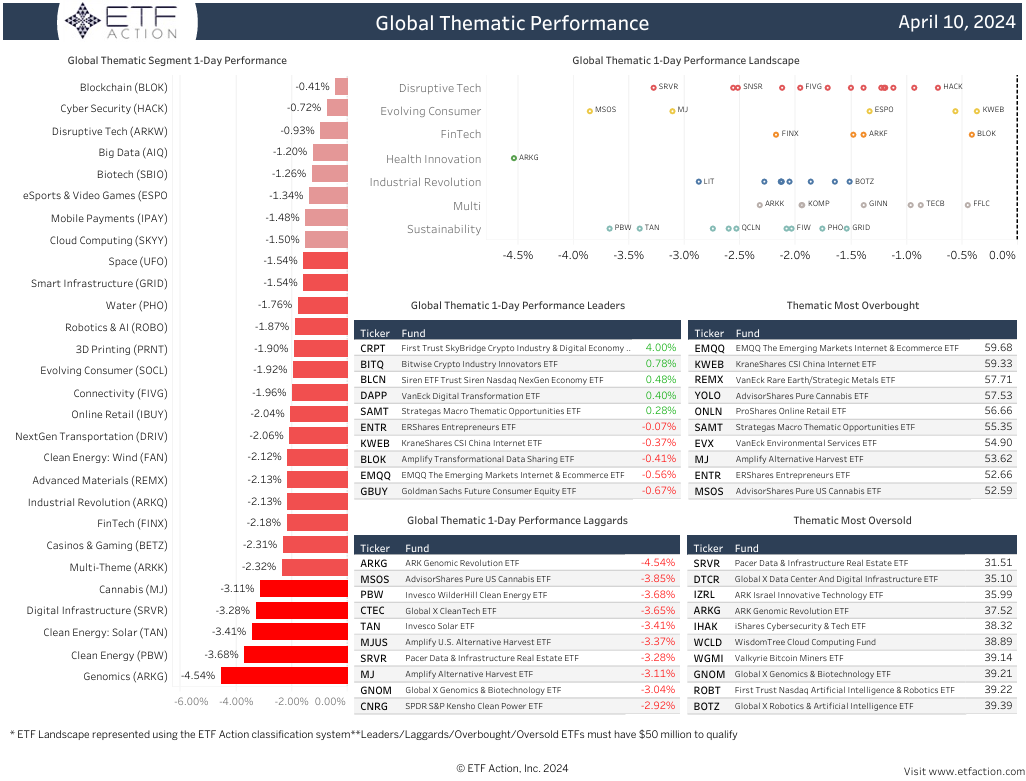
Daily Note
4.10.2024
Equities: Ahead of Wednesday’s key Consumer Price Index (CPI) report, U.S. markets were mixed yesterday with The NASDAQ 100 (QQQ) and the S&P 500 (SPY) gaining 37 bps and 12 bps, respectively, and the Dow Jones Industrial Average (DIA) dipping 7 bps. QQQ and SPY are now trading within 1% of new 52-week highs. DIA is trading just below its 50-day moving average but more than 7% above its 200-day moving average. Small Caps (IJR) also rose 46 bps while Mid Caps (IJH) added 13 bps. Treasury yields eased on Tuesday with the U.S. 2-Year falling below 4.75% and the U.S. 10-Year sinking near 4.350% intraday. Alphabet climbed more than 1% ahead of the company’s Google Cloud Next Event keynote presentation. Earlier in the day, the company unveiled new custom Arm-based chips, taking a cue from Microsoft and Amazon, which have undertaken similar strategies. The CPI, which measures costs for a wide-ranging basket of goods and services, is expected to register monthly increases of 0.3% for the headline figure as well as the core figure that excludes volatile food and energy. On a yearly basis, that would put the inflation rates at 3.4% and 3.7%, respectively, a 0.2% increase for the headline rate from February and just a 0.1% decrease for the core rate. The Producer Price Index (PPI) figures will be released on Thursday.
Most U.S. factor strategies were in the green on Tuesday, led by S&P 500 High Beta (SPHB, +93 bps) and S&P 500 Dividend (SPYD, +77 bps). S&P 500 Momentum (SPMO, -42 bps) and S&P 500 Pure Growth (RPG, -39 bps) underperformed while S&P 500 Value (SPYV) added 24 bps. Developed ex- U.S. Markets (EFA) inched lower by 1 bps yesterday as Germany (EWG) sank 70 bps. South Korea (EWY) and France (EWQ) also declined around 50 bps and Hong Kong (EWH) increased 1.09%. Emerging Markets (EEM) advanced 67 bps, bolstered by solid returns from Thailand (THD, +2.49%), South Africa (EZA, +1.91%), Taiwan (EWT, +1.70%), and Brazil (EWZ, +1.45%). China (MCHI) also rose 90 bps.
Sectors: All U.S. sectors finished higher yesterday, except for Financials (XLF, -57 bps) and Industrials (XLI, -23 bps). XLF was dragged lower by Insurance (KIE, -1.67%) and XLI was impacted by Aerospace & Defense (XAR, -1.04%). Real Estate (XLRE) outpaced other sectors, jumping 1.27%. Utilities (XLU), Technology (XLK), Consumer Staples (XLP), and Consumer Discretionary (XLY) were all up around 50 bps while Health Care (XLV) increased 36 bps and Materials (XLB) rose 24 bps. XLK received a boost from Semiconductors (XSD, +2.18%) while XLV was lifted by Health Care Equipment (XHE, +1.67%) and Biotech (XBI, +1.37%). XLB hit fresh 52-week highs and is approaching overbought territory.
Themes: Solar (TAN) shined on Tuesday, advancing 4.07%. Most other global thematic segments were in positive territory for the day with Genomics (ARKG) gaining 3.30%, Advanced Materials (REMX) rising 2.94%, and Clean Energy (PBW) increasing 2.42%. Digital Infrastructure (SRVR, +1.59%) and NextGen Transportation (DRIV, +1.39%) were also strong. Cannabis (MJ) and Blockchain (BLOK) were the worst performing segments on the day, sinking 3.24% and 2.23%, respectively. Just 3 other segments saw losses yesterday: Disruptive Tech (ARKW, -38 bps), Mobile Payments (IPAY, -15 bps), and Smart Infrastructure (GRID, -4 bps).
Commodities & Yields: Broad Commodities (DJP) added 4 bps on Tuesday as Natural Gas (UNG) jumped 2.86%, Silver (SLV) gained 1.26%), and Corn (CORN) fell1.00%. WTI Crude Oil (USO) and Wheat (WEAT) each declined 1.28%. U.S. Aggregate Bonds (AGG) increased 34 bps, 20+ Year Treasury Bonds (TLT) advanced 93 bps, and the U.S. Dollar (UUP) dipped 3 bps. At yesterday’s close, the U.S. 2-Year Treasury Yield stood at 4.743% and the U.S. 10-Year Treasury Yield stood at 4.362%.
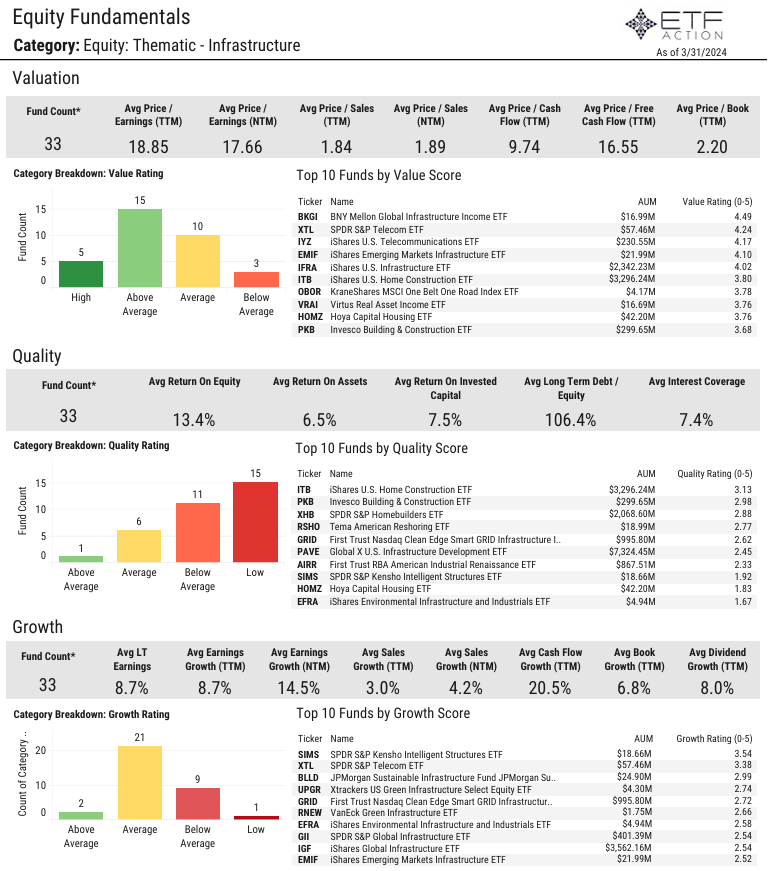
Infrastructure Category Report
4.10.2024
- The average expense ratio of the 33 Infrastructure ETFs is 51 bps, the average lifespan is 8.21 years, and the average TTM yield is 1.92%
- The Thematic - Infrastructure category has $24.6 billion in total assets under management, the largest ETF in the category is the Global X U.S. Infrastructure Development ETF (PAVE) with $7.3 billion in AUM
- Just 5 other ETFs in the category have over $1 billion in AUM (IGF, ITB, IFRA, NFRA, XHB)
- 21 of the 33 ETFs in the category have below $500K in average daily volume, average ADV is $17.80 million
- Infrastructure ETFs gathered nearly $1 billion in net inflows in March and have seen $2.31 billion in net inflows in the past year
- PAVE gathered $501.7 million in net inflows last month and $1.42 billion in net inflows over the last year
- Just 2 ETFs in the category posted losses in March (SRVR, XTL), average 1-month return was +3.68% and average 1-year return was +15.25%
- The SPDR S&P Homebuilders ETF (XHB) rose 8.44% last month and has surged nearly 70% in the past year
- The average 3-year average volatility relative to ACWI is 21.14%, average shapre ratio is 0.17, and average down capture is 107.15%
- The category is relatively diverse from a size & style perspective and has average stock concentration
- The highest average sector exposures for Infrastructure ETFs are Industrials (30.8%), Utilities (17.8%), and Real Estate (15.6%)
- Average price to earnings (TTM) is 18.85, average return on equity is 13.4%. and average dividend growth (TTM) is 8.0%
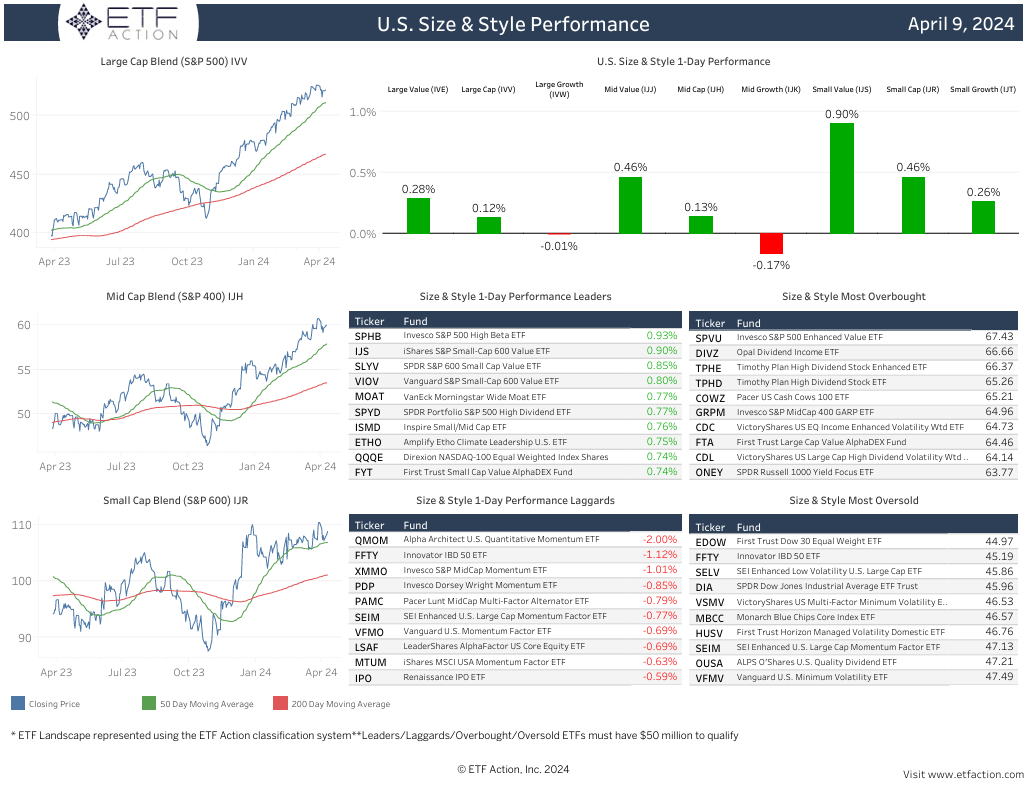
Daily Note
4.9.2024
Equities: Major averages were little changed on Monday following a losing week last week. The S&P 500 (SPY) and the Dow Jones Industrial Average (DIA) each rose 6 bps while the NASDAQ 100 (QQQ) added 3 bps. Small-Caps (IJR) and mid-Caps (IJH) outperformed, climbing 72 bps and 44 bps, respectively. Markets faced headwinds from treasury yields, which continued to push higher. The U.S.2-Year approached 4.80% and the U.S. 10-Year topped 4.45% intraday yesterday. Tesla jumped nearly 5% on Monday after CEO Elon Musk announced the company will reveal its robotaxi product on August 8th. Tesla has declined more than 33% year-to-date and recently reported Q1 vehicle deliveries that were lower than the same period a year ago. Bitcoin ETFs were also up more than 6% on the day. Investors are awaiting Wednesday’s Consumer Price Index (CPI) results followed by Thursday’s Producer Price Index (PPI) results, which will provide more clarity on inflationary pressures. According to the CME FedWatch Tool, there is a 0% chance that the Fed will cut rates at the next meeting and a 51.3% chance of a rate cut at the June meeting.
S&P 500 High Beta (SPHB) led other U.S. factor strategies on Monday, climbing 1.12%. S&P 500 Dividend (SPYD) also increased 90 bps and S&P 500 Pure Value (RPV) added 22 bps while S&P 500 Momentum (SPMO) slipped 37 bps and S&P 500 Quality (SPHQ) dipped 5 bps. Emerging Markets (EEM) rose 65 bps on strength from Brazil (EWZ, +2.23%), Taiwan (EWT, +72 bps), and India (INDA, +69 bps). Developed ex-U.S. Markets (EFA, +49 bps) were boosted by Germany (EWG, +73 bps) and France (EWQ, +71 bps). Hong Kong (EWH) dipped 19 bps.
Sectors: U.S. sectors were mixed yesterday with Consumer Discretionary (XLY, +95 bps) seeing the strongest returns. Real Estate (XLRE) gained 86 bps, Utilities (XLU) increased 66 bps, and Financials (XLF) were up 43 bps. XLF was bolstered by Regional Banks (KRE, +1.70%), Banks (KBE, +1.54%), and Capital Markets (KCE, +1.17%). After outperforming last week, Energy (XLE) slipped 63 bps, lagging other sectors. Health Care (XLV) also fell 32 bps while Industrials (XLI), Consumer Staples (XLP), and Technology (XLK) all declined around 15 bps. XLV, XLP, and XLRE are the only sectors trading below relative 50-day moving averages.
Themes: Advanced Materials (REMX), Disruptive Tech (ARKW), and Multi-Theme (ARKK) were the top performing global thematic segments on Monday, all advancing more than 2%. FinTech (FINX) and Blockchain (BLOK) all gained more than 1.65% while 3D Printing (PRNT) climbed 1.58%, Industrial Revolution (ARKQ) increased 1.55% and Genomics (ARKG) rose 1.44%. Solar (TAN, +1.41%) and Clean Energy (PBW, +1.18%) recovered from Friday’s losses. Evolving Consumer (SOCL) was the weakest returns, declining 71 bps. Casinos & Gaming (BETZ) also dropped 45 bps.
Commodities & Yields: U.S. Aggregate Bonds (AGG) dipped 9 bps, Preferred & Income Securities (PFF) fell 19 bps, and the U.S. Dollar (UUP) slipped 14 bps yesterday. At Monday’s closing bell, the U.S. 2-Year Treasury Yield stood at 4.793% and the U.S. 10-Year Treasury Yield stood at 4.422%. Broad Commodities (DJP) added 37 bps with Agriculture (DBA) dropping 80 bps, Industrial Metals (DBB) advancing 89 bps, and Precious Metals (DBP) rising 83 bps. Natural Gas (UNG) jumped 3.63% while Silver (SLV) and Copper (CPER) were both up more than 1%.
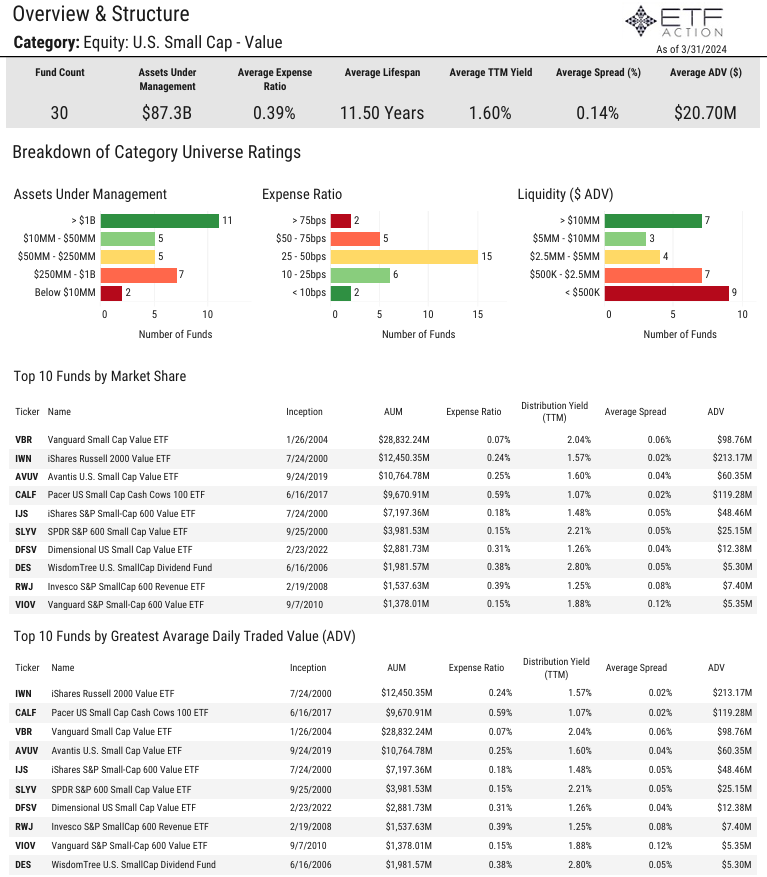
U.S. Small Cap Value Category Report
4.9.2024
- The U.S. Small Cap - Value category is comprised of 30 ETFs with $87.3 billion in total assets under management
- The average expense ratio of the category is 39 bps, the average lifespan is 11.50 years, and the average TTM yield is 1.60%
- 11 ETFs in the category have more than $1 billion in AUM and 2 ETFs have less than $10 million in AUM
- The Vanguard Small Cap Value ETF (VBR) is the largest ETF in the category with $28.8 billion
- The average daily volume of the category is $20.70 million, the iShares Russell 2000 Value ETF (IWN) has the highest ADV with $213.17 million
- U.S. Small Cap - Value ETFs gathered $1.18 billion in net inflows in March and $4.17 billion in net inflows int the 1st quarter
- All ETFs in the category gained more than 1.60% in March, average 1-month return was +3.93% and average return for Q1 was +2.54%
- The Themes US Small Cap Cash Flow Champions ETF (SMCF, +8.20%) was the best performer last month
- The average 3-year volatility relative to the S&P 500 (SPY) was 21.75% and average correlation was 0.80
- The average top 10 holdings weight is just 12.07% and average weighted average market cap was $2.99 billion
- The category has high average sector exposure towards Financials (23.0%), Industrials (17.2%), and Consumer Discretionary (16.1%)
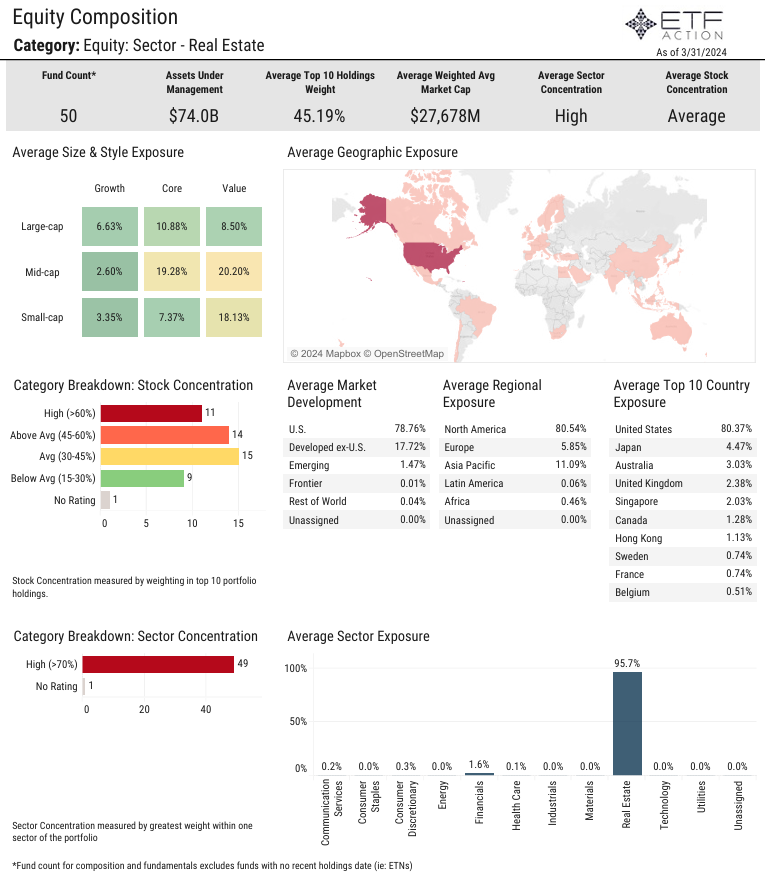
Real Estate Category Report
4.8.2024
- The 50 Real Estate ETFs have $74.0 billion in assets under management, the Vanguard Real Estate ETF (VNQ) is the largest ETF in the category with $33.8 billion in AUM
- The average expense ratio of the category is 42 bps, the average lifespan is 9.33 years, and the average TTM yield is 3.17%
- 25 of the ETFs in the category have average daily volume below $500K, the iShares U.S. Real Estate ETF (IYR) has the largest ADV at $591.5 million
- Real Estate ETFs gathered $2.13 billion in net inflows in March, IYR saw the largest net inflows with $1.1 billion
- All Real Estate ETFs registered positive returns last month, average return was +3.05% and average YTD return was -1.65%
- The iShares International Developed Real Estate ETF (IFGL) and the iShares International Developed Property ETF (WPS) both jumped more than 6.4% in March
- The ALPS Active REIT ETF (REIT) has the highest sharpe ratio (3-year) relative to the iShares MSCI ACWI ETF (ACWI)
- The average top 10 holdings weight of the category is 45.19%
- The category has high average tilts to Mid-Cap Value (20.20%), Mid-Cap Core (19.28%), and Small-Cap Value (18.13%) names
- Average price to earnings (TTM) of the category is 28.02, the average return on equity is 6.3%, and the average dividend growth (TTM) is 6.9%
Daily Note
4.8.2024
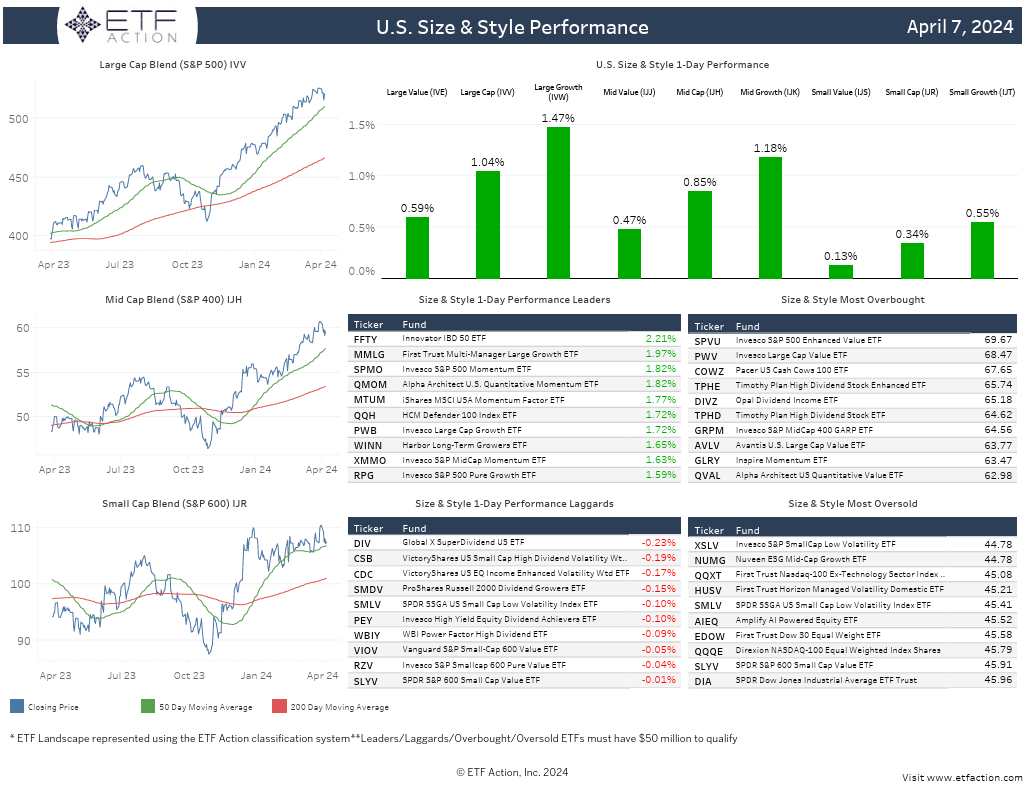
Equities: Following a stronger-than-expected Employment Situation report, U.S. markets posted gains on Friday. The NASDAQ 100 (QQQ) climbed 1.18%, the S&P 500 (SPY) rose 1.04%, and the Dow Jones Industrial Average (DIA) increased 74 bps. Despite Friday’s positive returns, all three major averages finished lower last week with DIA declining 2.24%, SPY sinking 89 bps, and QQQ falling 80 bps. The Labor Department reported on Friday that nonfarm payrolls jumped 303K in March, well above the +200K estimates and higher than the downwardly revised +270K gain in February. Wages rose 0.3% for the month and 4.1% from a year ago, both in line with estimates. The unemployment rate edged lower to 3.8%, as expected, even though the labor force participation rate moved higher to 62.7%. Treasury yields pushed higher following the strong jobs report with the U.S. 2-Year nearing 4.75% and the U.S. 10-Year increasing above 4.40% intraday. This week, investors will be looking towards the Consumer Price Index (CPI) and Producer Price Index (PPI) results along with the release of the latest Federal Open Market Committee (FOMC) meeting minutes and several speeches from Fed officials.
All U.S. factor strategies were in the green on Friday, led by S&P 500 Momentum (SPMO, +1.82%). S&P 500 Pure Growth (RPG) and S&P 500 Growth (SPYG) both advanced more than 1.50% and S&P 500 Quality (SPHQ) rose 1.16%. S&P 500 Dividend (SPYD) added just 30 bps on the day. SPMO increased 29 bps last week while all other factors saw losses. S&P 500 High Beta (SPHB) tumbled 2.26% and SPYD dropped 1.99%. Developed ex-U.S. Markets (EFA, +32 bps) were lifted by the Netherlands (EWN, +1.10%) on Friday. Hong Kong (EWH) and Australia (EWA) each gained more than 50 bps. Emerging Markets (EEM) were up 22 bps on strength from Thailand (THD, +1.60%), Mexico (EWW, +1.47%), and South Africa (EZA, +1.46%). EEM rose 41 bps last week while EFA slipped 1.11%.
Sectors: Industrials (XLI) jumped 1.39% on Friday, outpacing all other U.S. sectors, all of which were in positive territory. Technology (XLK), Energy (XLE), and Communication Services (XLC) all advanced more than 1% while Financials (XLF) increased 95 bps, Materials (XLB) gained 90 bps, and Health Care (XLV) climbed 89 bps. XLE hit new 52-week highs and was boosted by Oil & Gas Equipment & Services (XES, +1.47%). XLB was bolstered by Metals & Mining (XME, +1.42%) and XLV benefitted from strong returns from Health Care Equipment (XHE, +1.42%). Consumer Staples (XLP) was the worst performer on the day, adding just 16 bps. XLE surged nearly 4% last week. XLC also gained 1.05% while all other sectors declined. XLV sank 3.05%, Real Estate (XLRE) fell 2.91%, and Consumer Discretionary (XLY) retreated 2.75%.
Themes: Most global thematic segments saw positive returns on Friday with Cannabis (MJ, +1.90%) leading the charge. Casinos & Gaming (BETZ, +1.42%), Cloud Computing (SKYY, +1.33%), and Online Retail (IBUY, +1.28%) were all strong. Evolving Consumer (SOCL), Cyber Security (HACK), and Biotech (SBIO) were all up more than 1% while Big Data (AIQ) and eSports & Video Games (ESPO) both gained more than 80 bps. Solar (TAN) and Clean Energy (PBW) underperformed, slipping 1.35% and 99 bps, respectively. Blockchain (BLOK) and Advanced Materials (REMX) each fell more than 60 bps. Genomics (ARKG) and BLOK each plunged around 7% last week while Multi-Theme (ARKK) and Space (UFO) each declined nearly 6%. MJ was the best performing segment for the week, climbing 2.63%.
Commodities & Yields: The U.S. Dollar (UUP) added 11 bps, U.S. Aggregate Bonds (AGG) slipped 49 bps, and 20+ Year Treasury Bonds (TLT) dropped 1.39% on Friday. At the closing bell, the U.S. 2-Year Treasury Yield stood at 4.732% and the U.S. 10-Year Treasury Yield stood at 4.378%. Broad Commodities (DJP) gained 70 bps as Gold (GLD) climbed 1.71%, Silver (SLV) jumped 2.20%, Copper (CPER) increased 1.07%, and Agriculture (DBA) advanced 1.13%. SLV is up 15.51% over the past month.
Buffer ETFs Category Report
4.5.2024
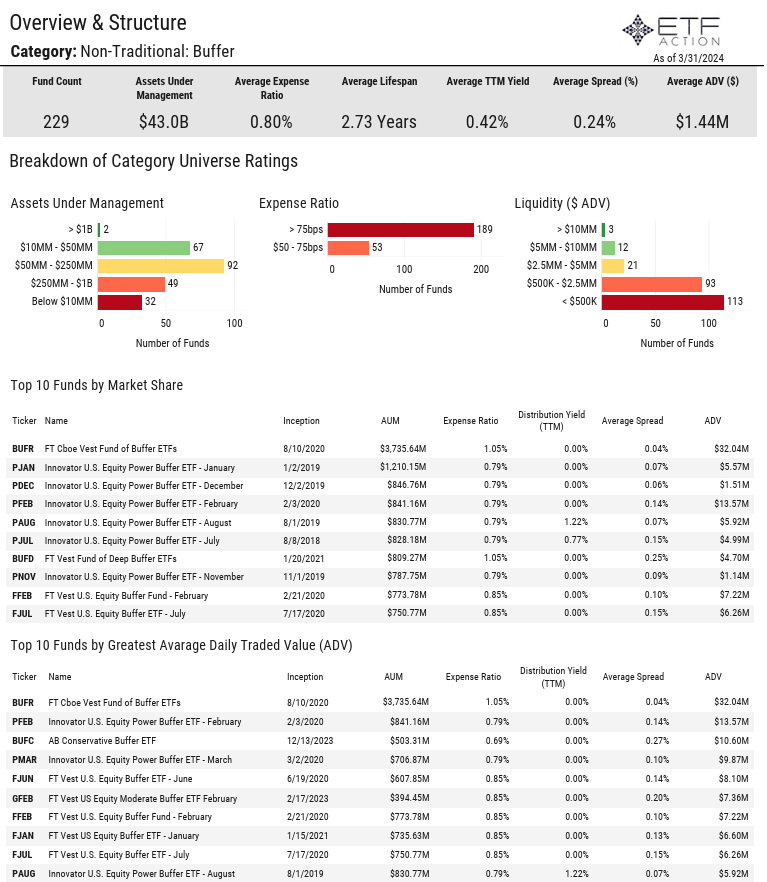
- The Non-Traditional: Buffer category is comprised of 229 ETFs with $43.0 billion in total assets under management
- The average expense ratio of the category is 80 bps, the average lifespan is 2.73 years, and the average TTM yield is 0.42%
- Just 2 ETFs in the category have more than $1 billion in AUM, the FT Cboe Vest Fund of Buffer ETFs (BUFR) is the largest with $3.7 billion in AUM
- 53 ETFs in the category have an expense ratio below 75 bps
- 113 ETFs in the category have an average daily volume of less than $500K, average ADV is $1.44 million
- Buffer ETFs gathered $90 million in net inflows in March and have seen $3.30 billion in net inflows year-to-date
- Almost all Buffer ETFs registered positive returns in March, average 1-month return was +1.32% and average YTD return was +3.91%
- The FT Vest Gold Strategy Quarterly Buffer ETF (BGLD) was the best performer last month, climbing more than 6%
- BUFR gained 1.49% in March and has jumped more than 20% over the past year
Daily Note
4.5.2024
Equities: Ahead of Friday’s Employment Situation report, major averages were down sharply on Thursday. The NASDAQ 100 (QQQ) declined 1.53%, the Dow Jones Industrial Average (DIA) slipped 1.34%, and the S&P 500 (SPY) fell 1.22%. Markets were shaken by more cautious rhetoric from Federal Reserve officials. Yesterday, Minneapolis Federal Reserve President Neel Kashkari expressed caution that interest rate cuts might not happen this year unless there’s more progress on inflation. Richmond Federal Reserve President Thomas Barkin also noted Thursday that inflation data this year has been “a little less encouraging” but a strong labor market and macro economy allow Fed officials “time for the clouds to clear” before cutting rates. After rising above 4.40% intraday Wednesday, the U.S 10-Year was trading around 4.35% yesterday. The Labor Department Reported that jobless claims totaled 221K for the week ended March 30, up 9K from the previous week and higher than the 213K estimate. That was the highest total since January 27. In other economic news, the Commerce Department reported that the trade deficit rose to $68.9 billion in February, up $1.3 billion on the month and higher than the $67.7 billion estimate. That was the highest imbalance on the goods and services measure going back to April 2023.
All U.S. factor strategies dropped at least 50 bps yesterday with most falling more than 85 bps. S&P 500 Pure Growth (RPG) sank 2.08%, S&P 500 Growth (SPYG) and S&P 500 High Beta (SPHB) each declined 1.52%, and S&P 500 Quality (SPHQ) retreated 1.43%. S&P 500 Pure Value (RPV) and S&P 500 Momentum (SPMO) both decreased 1.34%. Emerging Markets (EEM) dipped 36 bps on weakness from Thailand (THD, -1.03%) and Taiwan (EWT, -40 bps). China (MCHI) slid 40 bps. Developed ex-U.S. Markets (EFA) slipped 86 bps as France (EWQ), the Netherlands (EWN), and Japan (EWJ) were all down more than 1%.
Sectors: All U.S. sectors finished in negative territory on Thursday with Technology (XLK, -1.58%) falling the furthest. Health Care (XLV) also sank 1.44%, dragged lower by Biotech (XBI, -1.70%), and Communication Services (XLC) fell 1.35%. Consumer Discretionary (XLY), Financials (XLF), and Materials (XLB) all slid more than 1% followed by Industrials (XLI, -88 bps) and Real Estate (XLRE). Energy (XLE) inched lower by just 6 bps and remains in overbought territory. Oil & Gas Exploration & Production (XOP) was the only industry to see gains yesterday, adding just 3 bps. All sectors are trading above relative 200-day moving averages.
Themes: Volatility continued for Cannabis (MJ) as it plummeted 7.88% on Thursday following a 9.59% gain on Wednesday. All other global thematic segments were in the red with most dropping more than 1%. Biotech (SBIO) declined 2.17%, Mobile Payments (IPAY) fell 1.94%, and Online Retail (IBUY) retreated 1.83%. Blockchain (BLOK) and Connectivity (FIVG) both slipped more than 1.70% while FinTech (FINX), Genomics (ARKG), and Advanced Materials (REMX) all sank around 1.60%. ARKG is approaching oversold territory and is trading more than 10% below its 50-day and 200-day moving averages.
Commodities & Yields: At yesterday’s closing bell, the U.S. 2-Year Treasury Yield stood at 4.641% and the U.S. 10-Year Treasury Yield stood at 4.309%. The U.S. Dollar (UUP) was flat, U.S. Aggregate Bonds (AGG) rose 24 bps, and 20+ Year Treasury Bonds (TLT) increased 72 bps on Thursday. Broad Commodities (DJP) inched higher by 3 bps as WTI Crude Oil (USO) gained 1.26%, Natural Gas (UNG) slumped 3.92%, Silver (SLV) dropped 97 bps, and Industrial Metals (DBB) advanced 48 bps.
Daily Note
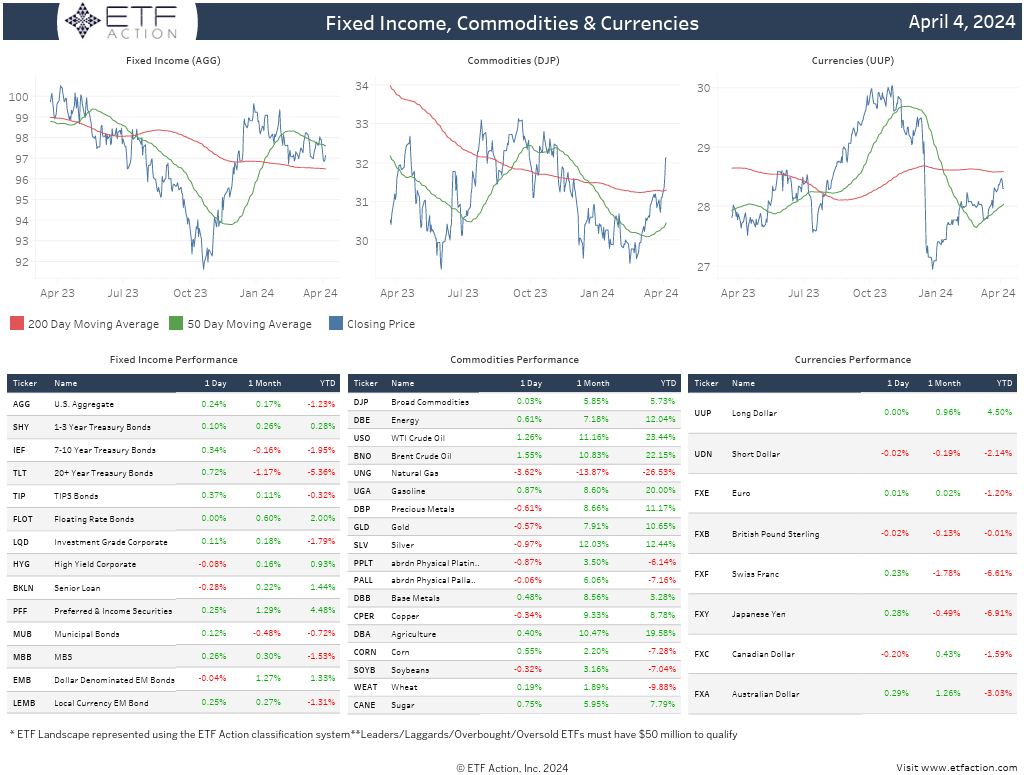
4.4.2024
Equities: The NASDAQ 100 (QQQ) and the S&P 500 (SPY) added 22 bps and 11 bps, respectively, on Wednesday while the Dow Jones Industrial Average (DIA) dipped 9 bps. Meanwhile, Small-Caps (IJR) gained 64 bps and Mid-Caps (IJH) advanced 45 bps. Investors weighed comments from Federal Reserve Chairman Jerome Powell and other Fed officials yesterday. Powell said Wednesday it will take a while for policymakers to evaluate the current state of inflation, keeping the timing of potential interest rate cuts uncertain. Atlanta Federal Reserve President Raphael Bostic expressed concern Wednesday about the pace of inflation and indicated he doesn’t think interest rate cuts should come until much later in the year. Separately, ADP reported private payrolls increased 184K in March, up from the upwardly revised +155K gain in February. March’s job growth was the fastest pace since July 2023. ADP also reported that wages for workers who stayed in their jobs increased 5.1% from a year ago, the same rate as February after showing a steady easing going well back into 2023. Intel sank more than 8% on the day after the revealing a $7 billion operating loss within its semiconductor manufacturing segment. Jobless claims data will be released Thursday followed by the Employment Situation report on Friday.
U.S. factor strategies were mixed yesterday with S&P 500 Growth (RPG) climbing 80 bps, S&P 500 Pure Value (RPV) rising 66 bps, and S&P 500 Low Volatility (SPLV) slipping 51 bps. S&P 500 Momentum (SPMO) also increased 54 bps, S&P 500 High Beta (SPHB) advanced 43 bps, and S&P 500 Value (SPYV) dropped 18 bps. Developed ex-U.S. Markets (EFA) gained 56 bps as the Netherlands (EWN) and Germany (EWG) both increased more than 95 bps. Emerging Markets (EEM) inched higher by 7 bps with South Africa (EZA) adding 46 bps and China (MCHI) declining 30 bps.
Sectors: Consumer Staples (XLP) was the worst performing U.S. sector on Wednesday, falling 1.10%. Utilities (XLU) also declined 40 bps while Health Care (XLV) and Financials (XLF) saw modest losses. Communication Services (XLC) advanced 79 bps followed by Energy (XLE, +68 bps), Materials (XLB, +62 bps), and Industrials (XLI, +51 bps). XLE received a boost from Oil & Gas Equipment & Services (XES, +2.03%) and XLB was lifted by Metals & Mining (XME, +2.19%). XLE and XLC both hit new 52-week highs. XLE and XLB are the only sectors sitting in overbought territory. Technology (XLK) also added 27 bps on the day.
Themes: Cannabis (MJ) rocketed 9.59% yesterday, handily outpacing other global thematic segments. Advanced Materials (REMX) increased 2.69% while Clean Energy (PBW), Casinos & Gaming (BETZ), Evolving Consumer (SOCL), and Solar (TAN) climbed more than 1%. Wind (FAN) and Smart Infrastructure (GRID) both rose 98 bps, Cloud Computing (SKYY) advanced 87 bps, and Blockchain (BLOK) gained 84 bps. Just three segments saw slight losses on Wednesday: Digital Infrastructure (SRVR, -7 bps), FinTech (FINX, -4 bps), and Cyber Security (HACK, -2 bps).
Commodities & Yields: U.S. Aggregate Bonds (AGG) added 6 bps, Preferred & Income Securities (PFF) rose 31 bps, and the U.S. Dollar (UUP) dropped 46 bps on Wednesday. At the closing bell, the U.S. 2-Year Treasury Yield stood at 4.679% and the U.S. 10-Year Treasury Yield stood at 4.355%. Broad Commodities (DJP) jumped 1.46% as Industrial Metals (DBB) surged 3.07% and Precious Metals (DBP) climbed 1.40%. Silver (SLV) and Copper (SLV) both jumped more than 3%.
U.S. Large Cap Growth Category Report
4.3.2024
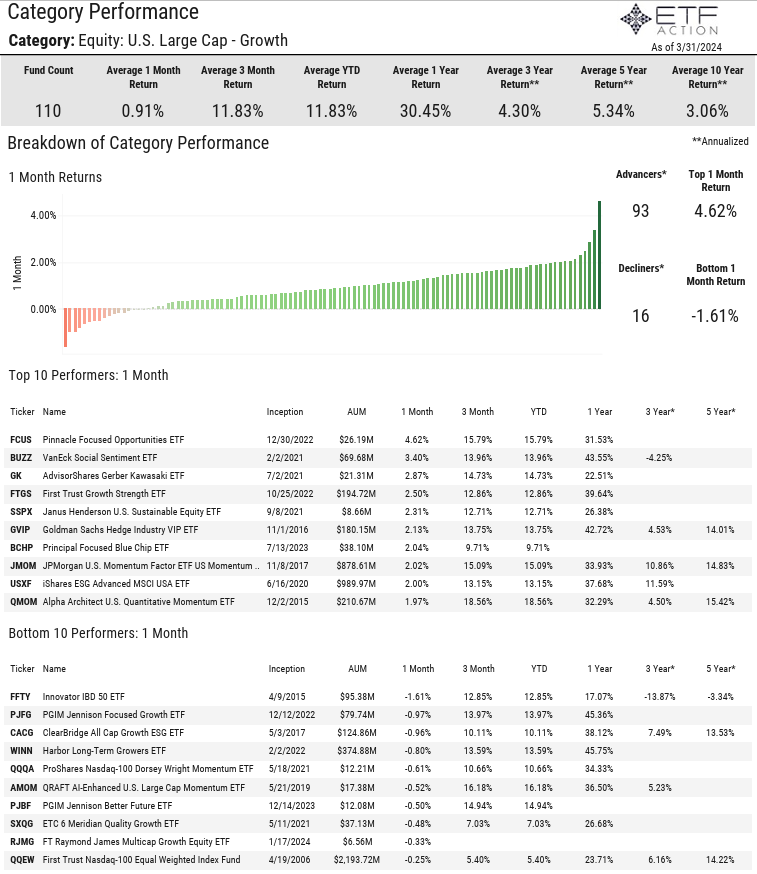
- The U.S. Large Cap - Growth category is comprised of 110 ETFs with $722.1 billion in total assets under management
- The average expense ratio of the category is 48 bps, the average lifespan is 6.79%, and the average TTM yield is 0.40%
- 29 ETFs in the category have more than $1 billion in AUM, the Invesco QQQ Trust Series I (QQQ) is the largest with $259.9 billion in AUM followed by the Vanguard Growth ETF (VUG) with $118.6 billion in AUM
- 12 ETFs in the category have expense ratios below 10 bps versus 22 with expense ratios greater than 75 bps
- U.S. Large Cap - Growth ETFs gathered $10.47 billion in net inflows in March and $24.66 billion in net inflows int the 1st quarter
- Most ETFs in the category saw positive returns in March, average 1-month return was +0.91% and average return for Q1 was +11.83%
- The Pinnacle Focused Opportunities ETF (FCUS, +4.62%) was the top performer in March
- The average 3-year volatility relative to the S&P 500 (SPY) was 21.39 and average correlation was 0.92
- The average top 10 holdings weight is 44.80% and average weighted average market cap was $802.1 billion
- U.S. Large Cap - Growth ETFs have high average sector concentration towards Technology (39.0%)
Daily Note
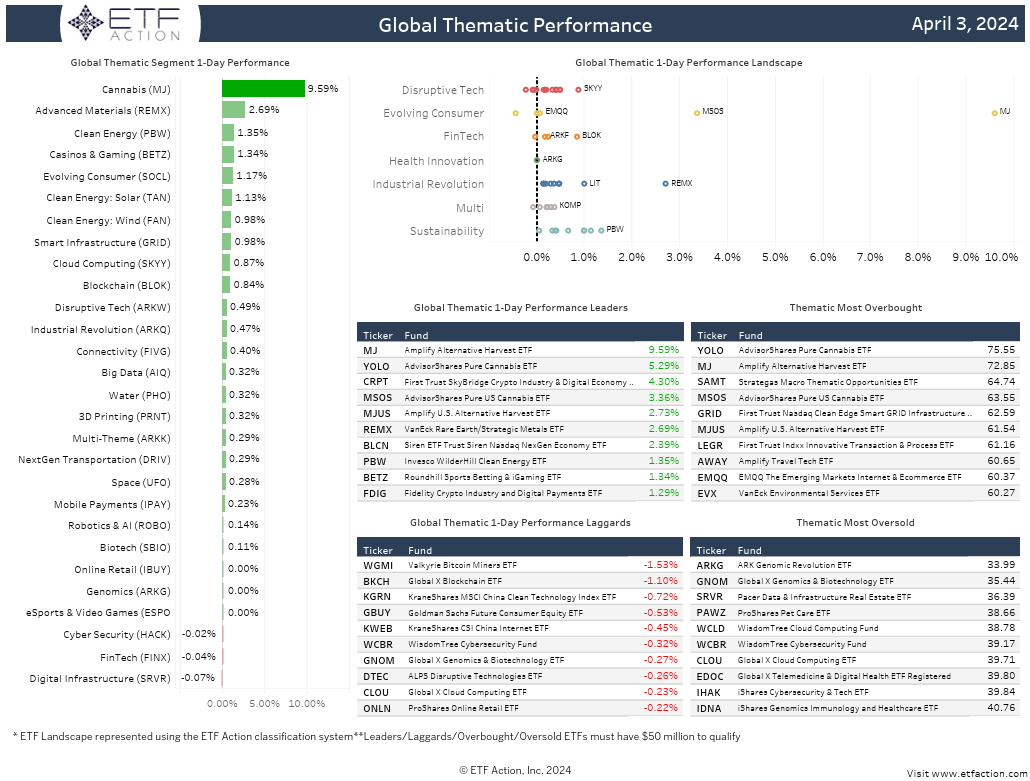
4.3.2024
Equities: U.S. equity markets declined on Tuesday following cautious rhetoric from Federal Reserve officials. The Dow Jones Industrial Average (DIA) dropped 94 bps, the NASDAQ 100 (QQQ) fell 86 bps, and the S&P 500 (SPY) sank 64 bps. Small-Caps (IJR) and Mid-Caps (IJH) also slipped 1.75% and 1.32%, respectively. Cleveland Fed President Loretta Mester said Tuesday she still expects interest rate cuts this year but ruled out the next policy meeting in May. San Francisco Fed President Mary Daly also said Tuesday that three reductions this year is a “very reasonable baseline” though she said nothing is guaranteed. The U.S. 10-Year continued to push higher yesterday touching 4.40% intraday. Tesla retreated nearly 5% on the day after reporting disappointing vehicle deliveries in the 1st quarter. Deliveries decreased 8.5% from the same quarter last year and was the company’s first year-over-year decline in deliveries since 2020. UnitedHealth also plunged 6.44% after the Centers for Medicare & Medicaid Services announced the 2025 rate for Medicare Advantage and prescription drug coverage. On the economic front, the Job Openings & Labor Turnover Survey (JOLTS) showed that available positions were little changed in February at 8.76 million. However, the ratio of openings to available workers declined considerably, down to 1.35 from 1.43 the previous month, indicating more loosening of the labor market. Federal Reserve Chairman Jerome Powell will speak on Wednesday along with several other officials.
Growth-oriented pockets of the markets underperformed yesterday with S&P 500 High Beta (SPHB) falling 1.80% and S&P 500 Pure Growth (RPG) sinking 1.23%. All other U.S. factor strategies finished lower. S&P 500 Low Volatility (SPLV, -26 bps) and S&P 500 Dividend (SPYD, -50 bps) were the top performers. Emerging Markets (EEM) added 32 bps on Tuesday on strength from South Africa (EZA, +1.05%) and Brazil (EWZ, +57 bps). Developed ex-U.S. Markets (EFA) dropped 70 bps as Switzerland (EWL), the Netherlands (EWN), Germany (EWG), and France (EWQ) all slipped more than 1%.
Sectors: Energy (XLE) climbed 1.40% on Tuesday, handily outpacing other U.S. sectors. XLE hit fresh 52-week highs and was bolstered by Oil & Gas Equipment & Services (XES, +2.23%) and Oil & Gas Exploration & Production (XOP, +72 bps). Utilities (XLU) added just 17 bps and was the only other sector in positive territory. Health Care (XLV, -1.56%) and Consumer Discretionary (XLY, -1.47%) were the worst performers. XLV was pulled lower by Health Care Services (XHS, -2.75%) and Health Care Equipment (XHE, -2.45%). Real Estate (XLRE) sank 1.11%, Technology (XLK) declined 96 bps, and Financials (XLF), Consumer Staples (XLP), and Industrial (XLI) all dropped around 50 bps.
Themes: All global thematic segments were in the red yesterday, except for Cannabis (MJ, +97 bps). Genomics (ARKG) plunged 4.41% followed by Solar (TAN, -3.73%), Clean Energy (PBW, -3.39%), Multi-Theme (ARKK, -2.97%), Blockchain (BLOK, -2.90%), and Space (UFO, -2.83%). Biotech (SBIO), Disruptive Tech (ARKW) and Industrial Revolution (ARKQ) were both down more than 2% while Online Retail (IBUY) slid 1.81%, NextGen Transportation (DRIV) dropped 1.58%, 3D Printing (PRNT) retreated 1.55%, and Casinos & Gaming (BETZ) declined 1.46%. The Valkyrie Bitcoin Miners ETF (WGMI) and the VanEck Digital Transformation ETF (DAPP) both plummeted more than 7% on the day.
Commodities & Yields: The U.S. Dollar (UUP) dipped 14 bps, U.S. Aggregate Bonds (AGG) slipped 7 bps, and Preferred & Income Securities (PFF) fell 73 bps yesterday. At the close, the U.S. 2-Year Treasury Yield stood at 4.701% and the U.S. 10-Year Treasury Yield stood at 4.365%. Broad Commodities (DJP, +91 bps) were lifted by Energy (DBE, +1.82%), Precious Metals (DBP, +2.04%), and Industrial Metals (DBB, +1.11%). Silver (SLV) jumped 4.29% while WTI Crude Oil (USO), Gasoline (UGA), and Gold (GLD) were all up more than 1%. Agriculture (DBA) also dropped 1.24%.
Sustainability Category Report
4.3.2024
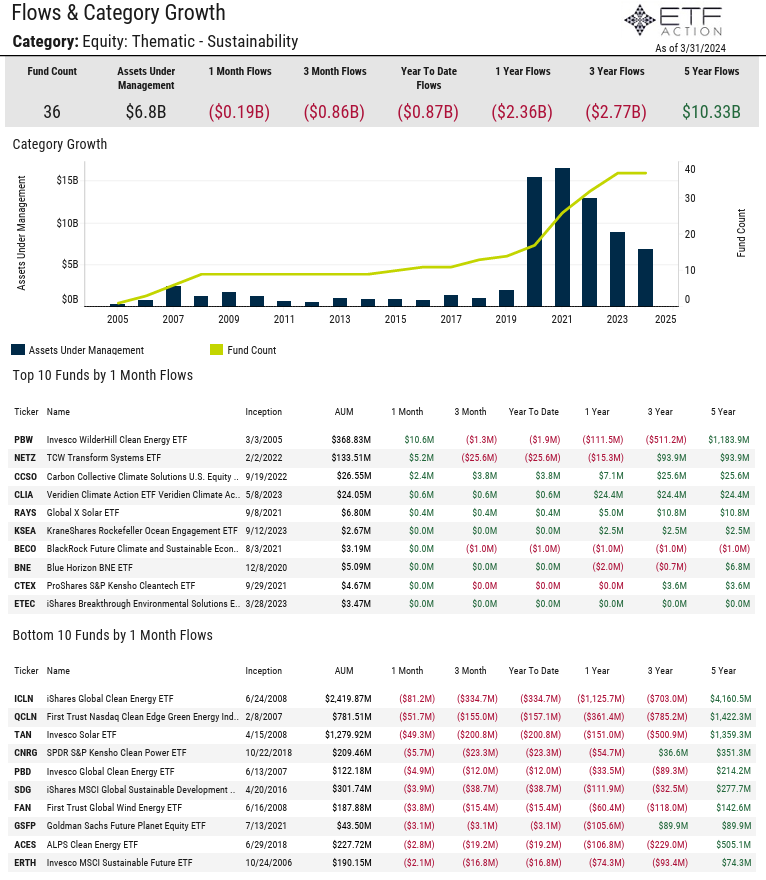
- The average expense ratio of the 36 Sustainability ETFs is 62 bps, the average lifespan is 6.59 years, and the average TTM yield is 1.17%
- The category has relatively high expense ratios and low liquidity relative to the broader market
- 26 ETFs in the category have average ADV below $500K and just 2 ETFs in the category have assets under management greater than $1 billion
- The iShares Global Clean Energy ETF (ICLN) has $2.42 billion in AUM followed by the Invesco Solar ETF (TAN) with $1.28 billion in AUM
- Sustainability ETFs saw nearly $1 billion in net outflows in Q1 and have seen $2.36 billion in net outflows over the past year
- ICLN saw $334.7 million in net outflows in March and has seen $1.13 billion in net outflows over the past year
- The category saw mixed returns in March, the Macquarie Energy Transition ETF (PWER, +9.07%) was the top performer and the First Trust Nasdaq Clean Edge Green Energy Index Fund (QCLN, -6.95%) was the worst performer
- Average 1-year return is -12.86% and the average 3-year annualized return for the category is -6.68%
- The category has above average stock concentration and above average/ high volatility ratings
- Highest average sector exposure is Industrials (35.0%), Utilities (25.6%), and Technology (18.8%)
Daily Note
4.2.2024
Equities: The NASDAQ 100 (QQQ) gained 21 bps while the Dow Jones Industrial Average (DIA) slipped 61 bps and the S&P 500 (SPY) dipped 17 bps to start the 2nd quarter. Investors digested the Personal Consumption Expenditures (PCE) Index results, released during the market’s closure for Good Friday. Core PCE, which excludes food and energy, showed inflation rose 2.8% on a 12-month basis in February, in line with expectations. On a monthly basis, the measure was up 0.3% from a month ago, the Commerce Department said. Treasury yields rose yesterday with the U.S. 2-Year climbing above 4.70% and the U.S. 10-Year approached 4.35%. According to the ISM Manufacturing Index, manufacturing in the U.S. expanded in March for the first time in 17 months. The index increased to 50.3 in March, up from 47.8 in February and better than the 48.1 estimate. The index measures the percentage of companies reporting expansion against contraction, so any figure above 50 indicates growth. Production posted the biggest gain, rising 6.2 points to 54.6, while prices also accelerated to 55.8, an increase of 3.3 points. Several Federal Reserve officials will speak on Tuesday. Factory Orders data and the Job Openings & Labor Turnover Survey (JOLTS) results will also be released.
S&P 500 Growth (SPYG) added 16 bps on Monday and was the lone U.S. factor strategy in positive territory. S&P 500 Dividend (SPYD) dropped 98 bps while S&P 500 Pure Value (RPV), S&P 500 High Beta (SPHB), and S&P 500 Value (SPYV) all slid more than 60 bps. All factors are trading above relative 50-day and 200-day moving averages. Developed ex-U.S. Markets (EFA, -43 bps) were impacted by losses from Japan (EWJ, -1.50%) and South Korea (EWY, -76 bps). The Netherlands (EWN) advanced another 77 bps and Hong Kong (EWH) climbed 64 bps. Emerging Markets (EEM) increased 17 bps on the day as China (MCHI) jumped 1.64%. Indonesia (EIDO) also sank 2.49% and Brazil (EWZ) declined 1.82%.
Sectors: Real Estate (XLRE) underperformed other U.S. sectors yesterday, sinking 1.75%. Health Care (XLV) slipped 85 bps and Consumer Staples (XLP) retreated 80 bps while Industrials (XLI) and Consumer Discretionary (XLY) both declined more than 70 bps. XLV was pulled lower by Health Care Equipment (XHE, -1.66%), Pharmaceuticals (XPH, -1.14%), and Health Care Services (XHS, -1.08%). Utilities (XLU, -61 bps) and Financials (XLF, -55 bps) were also weak on Monday. Communication Services (XLC) and Energy (XLE) saw the strongest returns, rising 77 bps and 74 bps, respectively. XLC and XLE each hit new 52-week highs. Technology (XLK) added 28 bps and was the only other sector in the green.
Themes: Most global thematic segments registered negative returns on Monday with Blockchain (BLOK, -2.41%) and Space (UFO, -2.41%) falling the furthest. FinTech (FINX, -2.01%), Mobile Payments (IPAY, -1.86%), and Multi-Theme (ARKK, -1.68%) followed. Disruptive Tech (ARKW), Genomics (ARKG), and Biotech (SBIO) all dropped around 1.40% while Cannabis (MJ) slipped 1.20% and Digital Infrastructure (SRVR) declined 1.15%. Advanced Materials (REMX) climbed 1.25%, Evolving Consumer (SOCL) gained 89 bps, and Big Data (AIQ) increased 62 bps. Cyber Security (HACK, +19 bps) and NextGen Transportation (DRIV, +12 bps) were the only other segments to post gains.
Commodities & Yields: The U.S. Dollar (UUP) added 39 bps, U.S. Aggregate Bonds (AGG) declined 72 bps, and 20+ Year Treasury Bonds (TLT) slid 1.86% on Monday. At yesterday’s closing bell, the U.S. 2-Year Treasury Yield stood at 4.718% and the U.S. 10-Year Treasury Yield stood at 4.329%. Broad Commodities (DJP, +87 bps) were boosted by WTI Crude Oil (USO, +1.19%), Natural Gas (UNG, +5.63%), Gold (GLD, +1.02%), Copper (CPER, +1.07%), and Agriculture (DBA, +1.25%).
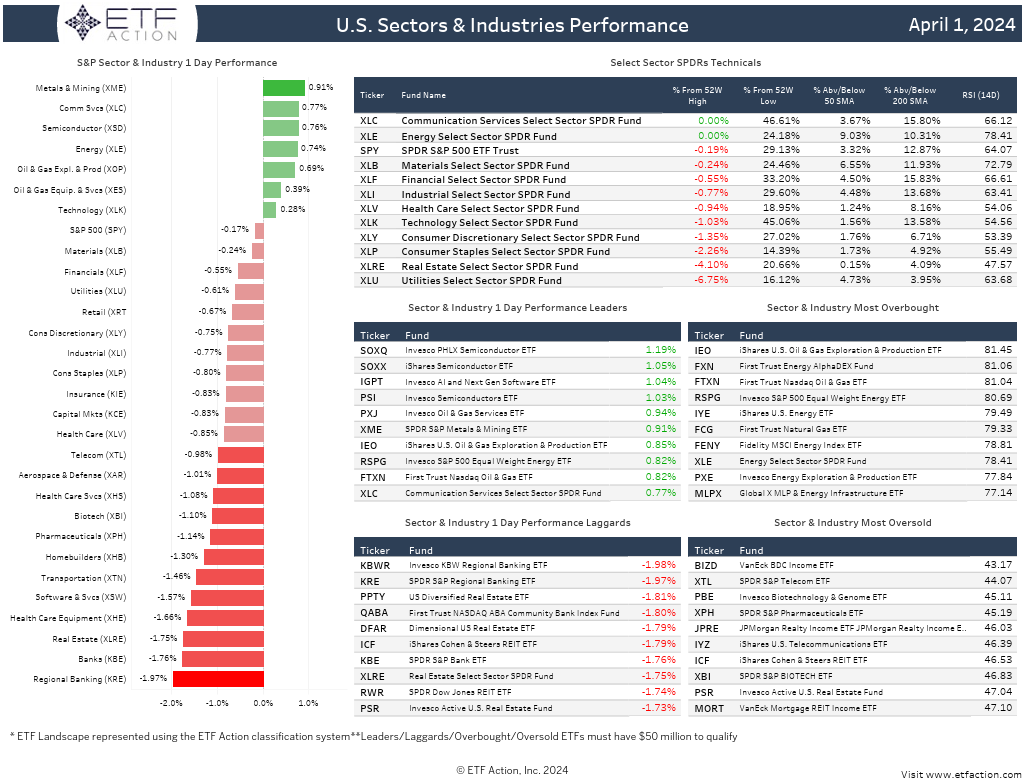
Daily Note
4.1.2024
Equities: On Thursday, major averages were mixed to close out the 1st quarter of 2024. The NASDAQ 100 (QQQ) and the S&P 500 (SPY) dipped 18 bps and 2 bps, respectively, while the Dow Jones Industrial Average (DIA) rose 5 bps to new 52-week highs. Small-Caps (IJR, +51 bps) and Mid-Caps (IJH, +26 bps) also hit new 52-week highs on the day and IJH entered overbought territory. In March, SPY gained 3.27%, DIA added 2.25%, and QQQ increased 1.27%. March was the 5th consecutive winning month for each major average. In the 1st quarter, SPY jumped 10.39%, QQQ advanced 8.56%, and DIA was up 6.02%. Q1 2024 was the 2nd consecutive winning quarter for all major averages. The Personal Consumption Expenditures (PCE) Index report was released on Friday during the market closure. Headline PCE increased 0.3% month-over-month and 2.5% year-over-year in February. Excluding volatile food and energy prices, Core PCE rose 0.3% for the month and 2.8% for the year, which was in line with expectations. Consumer spending shot up 0.8% on the month, well ahead of the 0.5% estimate, and personal income increased 0.3%, just below the 0.4% estimate. This week, investors will be looking towards the ISM Manufacturing Index results, Factory Orders Data, the Job Openings & Labor Turnover Survey (JOLTS) figures, and the Employment Situation report. Several Fed officials are also scheduled to speak, including Fed Chairman Jerome Powell on Wednesday.
S&P 500 Enhanced Value (SPVU, +1.00%) outgained other U.S. factor strategies on Thursday. Most factors were in the green with S&P 500 Dividend (SPYD) rising 82 bps, S&P 500 High Beta (SPHB) adding 42 bps, and S&P 500 Growth (SPYG) falling 29 bps. All factors saw gains in March. SPVU climbed more than 8%, SPYD increased 5.73%, and SPYG added 2.12%. All factors saw solid returns in Q1 with S&P 500 Momentum (SPMO) rocketing 22.68%, S&P 500 Pure Growth (RPG) surging nearly 14%, and SPVU rising 13.55%. Developed ex-U.S. Markets (EFA) sank 22 bps on Thursday as Hong Kong (EWH) declined 64 bps and the Netherlands (EWN) decreased 54 bps. Emerging Markets (EEM, 37 bps) were boosted by India (INDA, +98 bps) and China (MCHI, +53 bps). EFA was up 3.38% in March and 5.99% in Q1 while EEM advanced 2.73% in March and 2.16% in Q1. Japan (EWJ) and the Netherlands (EWN) both jumped around 11% in the 1st quarter.
Sectors: Just 3 U.S. sectors posted losses on Thursday: Consumer Discretionary (XLY, -31 bps), Technology (XLK, -22 bps), and Communication Services (XLC, -16 bps). Energy (XLE) outperformed, climbing 1.08% on strength from Oil & Gas Exploration & Production (XOP, +1.45%). Utilities (XLU) and Real Estate (XLRE) both gained more than 60 bps while Financials (XLF) rose 55 bps and Materials (XLB) added 27 bps. XLB, XLE, XLF, and Industrials (XLI, +2 bps) each hit new 52-week highs and sit in overbought territory. In March, XLY dipped 7 bps while all other sectors finished higher. XLE jumped 10.48% on the month while XLU and XLB each advanced more than 6%. XLRE was the lone sector in negative territory in Q1, declining 65 bps. XLE surged 13.51%, XLF and XLC both climbed more than 12%, and XLI increased almost 11%.
Themes: Cannabis (MJ) declined 2.79% on Thursday and lagged other global thematic segments. Wind (FAN, -52 bps), eSports & Video Games (ESPO, -30 bps), and Smart Infrastructure (GRID, 22 bps) were also weak. Advanced Materials (REMX) and Mobile Payments (IPAY) were the top performers, both advancing more than 1%. Clean Energy (PBW) increased 92 bps and Blockchain (BLOK) added 86 bps. MJ soared 24.66% in March and 31.22% in the 1st quarter. Most segments were in positive territory for both periods. BLOK rose 8.61% in March and 22.08% in Q1. Solar (TAN) also climbed 5.42% last month but dropped nearly 15% in the 1st quarter. PBW was down 21.90% in Q1 and REMX sank 16.56% for the quarter. IPAY and ESPO increased 13.45% and 10.21%, respectively, in Q1.
Commodities & Yields: Broad Commodities (DJP) gained 1.20% on Thursday with all broad-based sectors in the green. Energy (DBE) increased 98 bps with WTI Crude Oil (USO), Natural Gas (UNG), and Gasoline (UGA) all rising more than 1%. Gold (GLD) was up 1.29% and Corn (CORN) advanced 3.28%. UNG dropped nearly 12% in March and 28.16% in Q1. USO increased 7.32% in March and 18.12% in Q1. GLD jumped 8.67% in March. Agriculture (DBA) also surged 11.63% last month and was up more than 19% in Q1. The U.S. Dollar (UUP) added 28 bps on Thursday while U.S. Aggregate Bonds (AGG) fell 12 bps, and 20+ Year Treasury Bonds (TLT) dipped 8 bps. UUP gained 4.72% in Q1 while TLT slipped 3.71%.
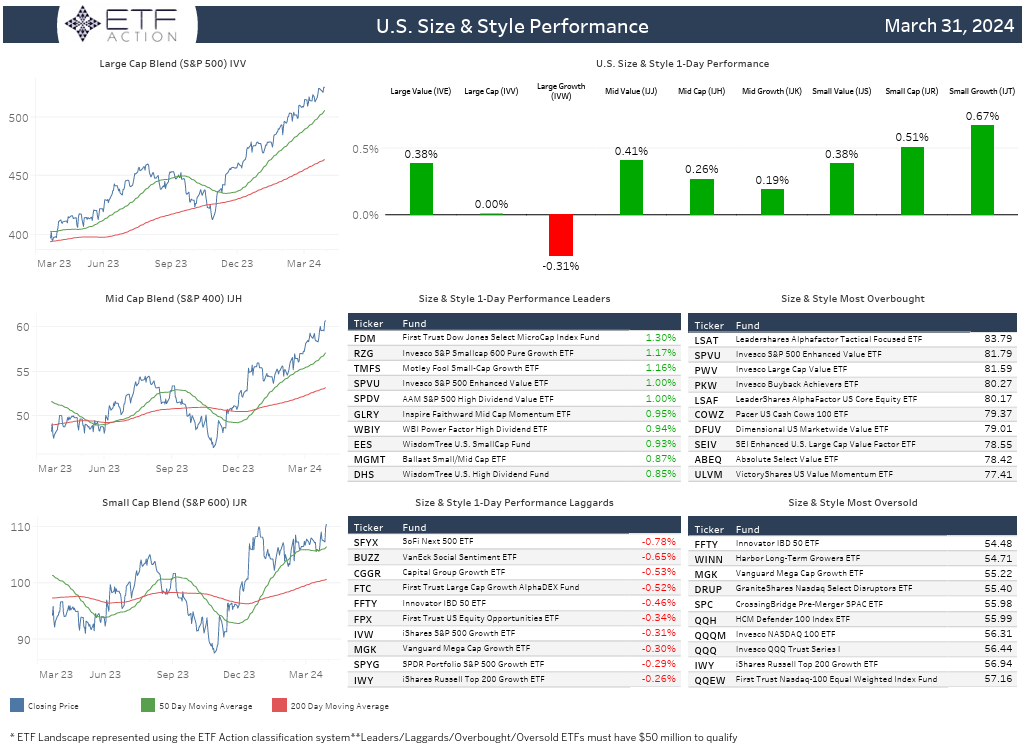
Energy Category Report
4.1.2024
- Energy ETFs saw $960 million in net outflows in the first quarter of 2024, the Energy Select Sector SPDR ETF (XLE) saw the largest net outflows in the period with $916 million
- However, XLE gathered $425 million in net inflows in March while the SPDR S&P Oil & Gas Exploration & Production ETF (XOP) gathered $290 million in net inflows
- The average expense ratio of the 42 Energy ETFs in the category is 61 bps, the average TTM Yield is 2.75%, and the average lifespan is 10.96 years
- The total assets under management in the category is $84.2 billion, XLE is the largest ETF in the category with $39.3 billion AUM
- Just 1 Energy ETF posted losses in March, average 1-month return was +8.21%, average return in Q1 was +10.56%
- Top performer last month was the Range Global Offshore Oil Services Index ETF (OFOS, +17.00%)
- Average 1-year return for the category is +22.54%, average 3-year annualized return is +19.47%
- The category has high and above average volatility ratings as well as high and above average value ratings
- The category is tilited towards large-cap value names and its top country sector exposure is the U.S. (85.30%)
- The average return on equity for the category is 19.6% and the average price/ earnings (TTM) is 11.17
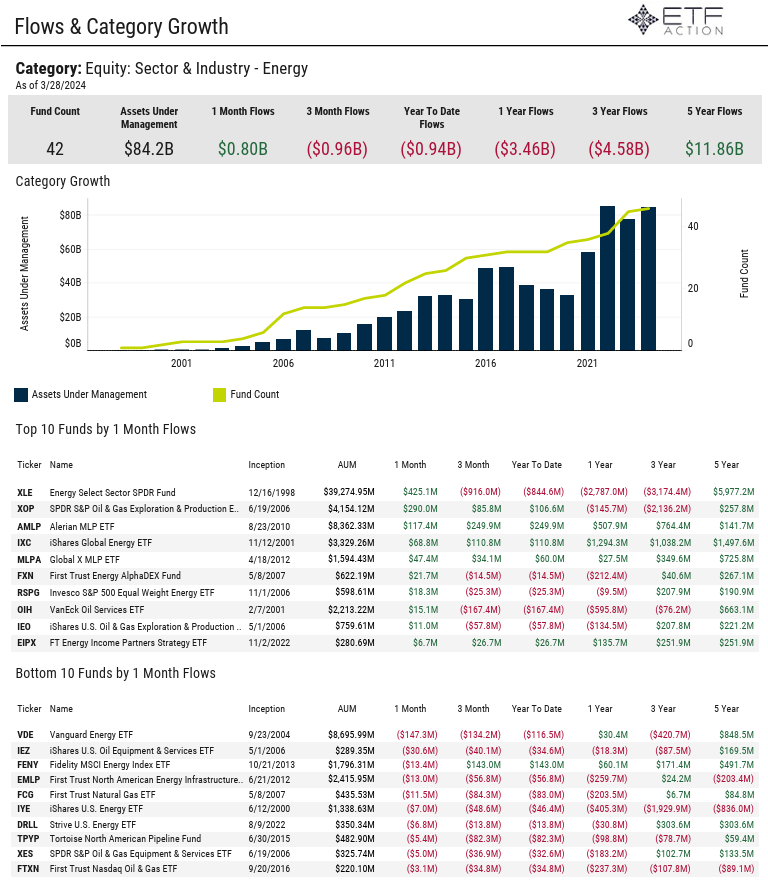
Daily Note
3.28.2024
Equities: Ahead of the final trading day of the 1st quarter, U.S. equity markets registered positive returns on Wednesday with the Dow Jones Industrial Average (DIA) rising 1.20%, the S&P 500 (SPY) adding 84 bps, and the NASDAQ 100 (QQQ) advancing 34 bps. SPY hit new 52-week highs, DIA is trading 5 bps from 52-week highs, and QQQ is trading within 40 bps of 52-week highs. All three major averages are on pace to see gains in March and for the 1st quarter. Small-Caps (IJR) outperformed yesterday, climbing 2.40%, while Mid-Caps (IJH) also increased 1.70%. Merck & Co (2.17% weight in DIA and 0.76% weight in SPY) jumped nearly 5% on Wednesday after the Food & Drug Administration (FDA) approved the company’s drug designed to treat a rare, progressive, and life-threatening lung condition called pulmonary arterial hypertension. On the earnings front, Cintas Corporation surged 8.25% after reporting a beat on the top and bottom lines in the fiscal 3rd quarter. The company also hiked its full-year guidance. GameStop plunged more than 15% after reporting disappointing Q4 revenue and announcing an unspecified number of job cuts to reduce costs. Investors will be monitoring Jobless Claims data and updated Q4 2023 U.S. GDP data released on Thursday followed by the Personal Consumption Expenditures (PCE) Index report on Friday.
All U.S. factor strategies posted gains yesterday with S&P 500 Dividend (SPYD, +2.54%) and S&P 500 High Beta (SPHB, +2.12%) leading the charge. S&P 500 Pure Value (RPV) also gained 2.03% while S&P 500 Pure Growth (RPG) added 33 bps and S&P 500 Momentum (SPMO) increased just 19 bps. SPMO is on pace to be the top performing factor in Q1, up 22.55% as of yesterday’s close. Developed ex-U.S. Markets (EFA) rose 60 bps on Wednesday as Australia (EWA) advanced 1.57%. Germany (EWG) and the Netherlands (EWN) were both up more than 90 bps on the day as well. Emerging Markets (EEM, +17 bps) were boosted by South Africa (EZA, +1.51%) and Mexico (EWW, +91 bps).
Sectors: Utilities (XLU) and Real Estate (XLRE) outperformed other U.S. sectors on Wednesday, advancing 2.79% and 2.53%, respectively. All other sectors were in the green with Industrials (XLI) gaining 1.61%, Materials (XLB) rising 1.43%, and Health Care (XLV) climbing 1.33%. XLB was lifted by Metals & Mining (XME, +3.22%) while XLV was bolstered by Health Care Equipment (XHE, +2.90%) and Biotech (XBI, +2.40%). Financials (XLF), Consumer Discretionary (XLY), and Consumer Staples (XLP) were all up more than 1% while Energy (XLE) added 93 bps. XLB, XLE, and XLI all hit new 52-week highs. XLRE is the only sector on pace for negative returns in the 1st quarter.
Themes: Most global thematic segments finished in positive territory yesterday led by Cannabis (MJ), which surged another 7.77%. Solar (TAN) and Clean Energy (PBW) were also strong, both jumping more than 5%. Advanced Materials (REMX), Genomics (ARKG), Biotech (SBIO), and NextGen Transportation (DRIV) all gained more than 2% as well. Casinos & Gaming (BETZ, -1.28%) and Disruptive Tech (ARKW, -59 bps) were the worst performers. Mobile Payments (IPAY, -40 bps) and Cloud Computing (SKYY, -17 bps) also lagged. MJ has rocketed nearly 34% thus far in the 1st quarter while PBW has slipped almost 25% in the period.
Commodities & Yields: U.S. Aggregate Bonds (AGG) rose 33 bps, 20+ Year Treasury Bonds (TLT) added 99 bps, and the U.S. Dollar (UUP) gained 7 bps on Wednesday. At the closing bell, the U.S. 2-Year Treasury Yield stood at 4.570% and the U.S. 10-Year Treasury Yield stood at 4.196%. Broad Commodities (DJP) dipped 32 bps as Natural Gas (UNG) fell 4.08%, Gold (GLD) climbed 72 bps, Corn (CORN) declined 1.21%, and Wheat (WEAT) increased 95 bps.
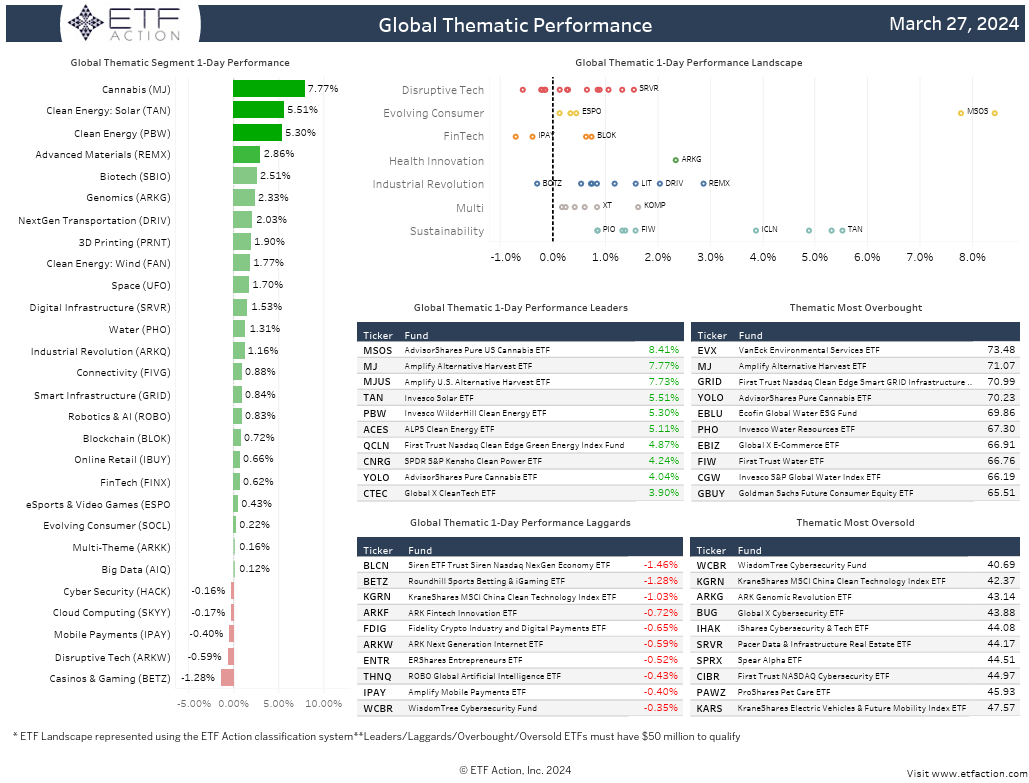
Multi-Theme Category Report
3.27.2024
- Year-to-date, Multi-Sector Thematic ETFs have seen $740 million in net outflows, the ARK Innovation ETF (ARKK) saw the largest net outflows in February with $381 million
- ARKK has also seen $874 million in net outflows thus far in 2024 and $1.3 billion in net outflows over the past year
- The category is comprised of 43 ETF with $16.4 billion in total assets under management
- ARKK is the largest ETF in the category with $8.21 billion in AUM, the iShares Exponential Technologies ETF (XT) also has $3.45 billion in AUM
- The averages expense ratio amongst Mutli-Sector Thematic ETFs is 67 bps, the average lifespan is 3.72 years, and the average TTM yield is 0.82%
- 35 of the 43 ETFs in the category have low liquidity ratings, average ADV for the category is $20.74 million
- The SPDR S&P Kensho New Economies Composite ETF (KOMP) is the cheapest ETF in the category with an expense ratio of 20 bps
- All ETFs in the category posted gains in February, average 1-month return was +5.21% and average 3-month return was +14.24%
- The KraneShares SSE STAR Market 50 Index ETF (KSTR, +10.86%) was the top performer in February
- The category has high and above average volatility ratings and is tilted significantly towards large-cap growth names
- The cateogry also has significant average sector exposure to Technology names (42.2%)
- Average earnings growth (NTM) is 44.5%, average dividend growth (TTM) is 20.3%, and average price to earnings (TTM) is 32.77
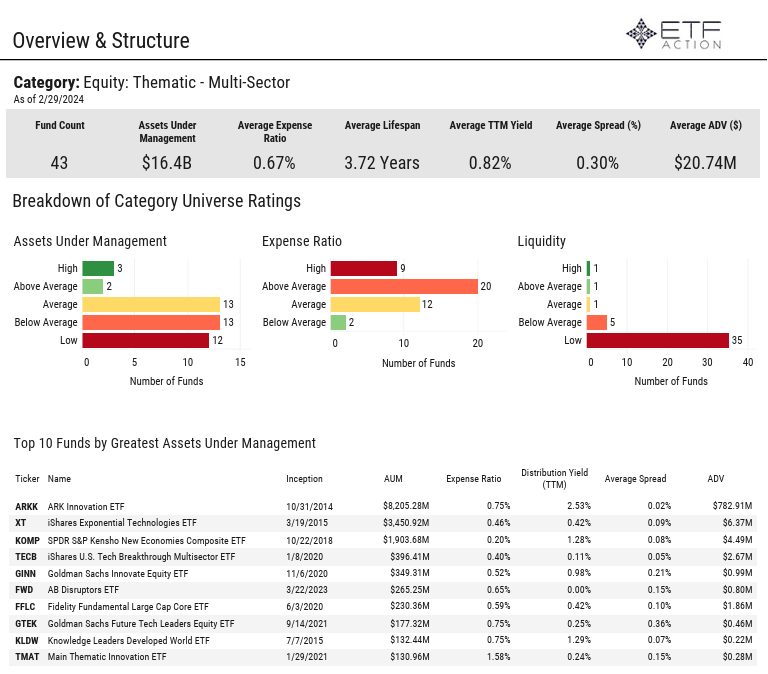
Daily Note
3.27.2024
Equities: U.S. equity markets were lower yesterday as investors weighed mixed economic data. The tech-oriented NASDAQ 100 (QQQ) fell 32 bps, the S&P 500 (SPY) dropped 18 bps, and the Dow Jones Industrial Average (DIA) dipped 3 bps. Tuesday was the third consecutive losing session for SPY and DIA. The Commerce Department reported yesterday that durable goods orders increased for the first time in 3 months in February. New orders placed with U.S. factories rose 1.4% month-over-month, following a downwardly revised 6.9% drop in January. Last month’s core orders, which exclude aircraft, rose at 0.7% while shipments decreased 0.4%. In a separate report, the Conference Board said its consumer confidence index was little changed at 104.7 in March and was below the 107 estimate. The third estimate of Q4 2023 U.S. gross domestic product (GDP) is due out Thursday followed by the Personal Consumption Expenditures (PCE) Index report on Friday. Fed Chairman Jerome Powell is also slated to speak on Friday. United Parcel Services plunged more than 8% on Tuesday after announcing disappointing short-term revenue guidance. However, the shipping giant also increased its target for 2026 revenue to between $108 billion and $114 billion.
S&P 500 Enhanced Value (SPVU, +5 bps) was the only U.S. factor strategy to register positive returns on Tuesday. S&P 500 Dividend (SPYD) dropped 76 bps and S&P 500 Momentum (SPMO) sank 53 bps while S&P 500 Pure Growth (RPG), S&P 500 Growth (SPYG), and S&P 500 Quality (SPHQ) were all down around 40 bps. Emerging Markets (EEM) dipped 7 bps as Taiwan (EWT) slipped 84 bps and Indonesia (EIDO) decreased 52 bps. Mexico (EWW) gained 1.29% on the day. Developed ex-U.S. Markets (EFA, +11 bps) benefitted from positive returns from Germany (EWG, +45 bps), Japan (EWJ, +44 bps), and the Netherlands (EWN, +26 bps).
Sectors: Seven of the 11 U.S. sectors were in negative territory yesterday. Utilities (XLU, -1.14%) fell the furthest, followed by Energy (XLE, -77 bps). XLE was pulled lower by Oil & Gas Equipment & Services (XES, -1.26%) and Oil & Gas Exploration & Production (XOP, -1.25%). Real Estate (XLRE), Technology (XLK), and Industrials (XLI) each declined around 40 bps while Communication Services (XLC) slipped 21 bps. XLC was impacted by Telecom (XTL), which slid 1.04% on the day. Health Care (XLV) and Financials (XLF) added 36 bps and 34 bps, respectively. Consumer Discretionary (XLY) advanced 13 bps and Consumer Staples (XLP) inched higher by 5 bps.
Themes: Volatility continued for Cannabis (MJ) on Tuesday as it climbed 5.63%. Casinos & Gaming (BETZ) also gained 1.13% and Biotech (SBIO) rose 96 bps. eSports & Video Games (ESPO), Mobile Payments (IPAY) and Evolving Consumer (SOCL) all added at least 30 bps. Advanced Materials (REMX) was the worst performing global thematic segment on the day, sliding 1.75%. Blockchain (BLOK) declined 1.21% and Genomics (ARKG), Solar (TAN), Digital Infrastructure (SRVR) all dropped more than 85 bps. Clean Energy (PBW) also dipped 78 bps. ARKG, SRVR, and PBW are all approaching oversold territory.
Commodities & Yields: At Wednesday’s closing bell, the U.S. 2-Year Treasury Yield stood at 4.597% and the U.S. 10-Year Treasury Yield stood at 4.238%. The U.S. Dollar (UUP) added 7 bps, U.S. Aggregate Bonds (AGG) increased 10 bps, and 20+ Year Treasury Bonds (TLT) rose 28 bps. Broad Commodities (DJP, -71 bps) were impacted by Industrial Metals (DBB, -1.22%) and Energy (DBE, -88 bps). Gasoline (UGA) was down 1.77%, Brent Crude Oil (BNO) fell 73 bps, Copper (CPER) dipped 44 bps, and Silver (SLV) slipped 1.06%.
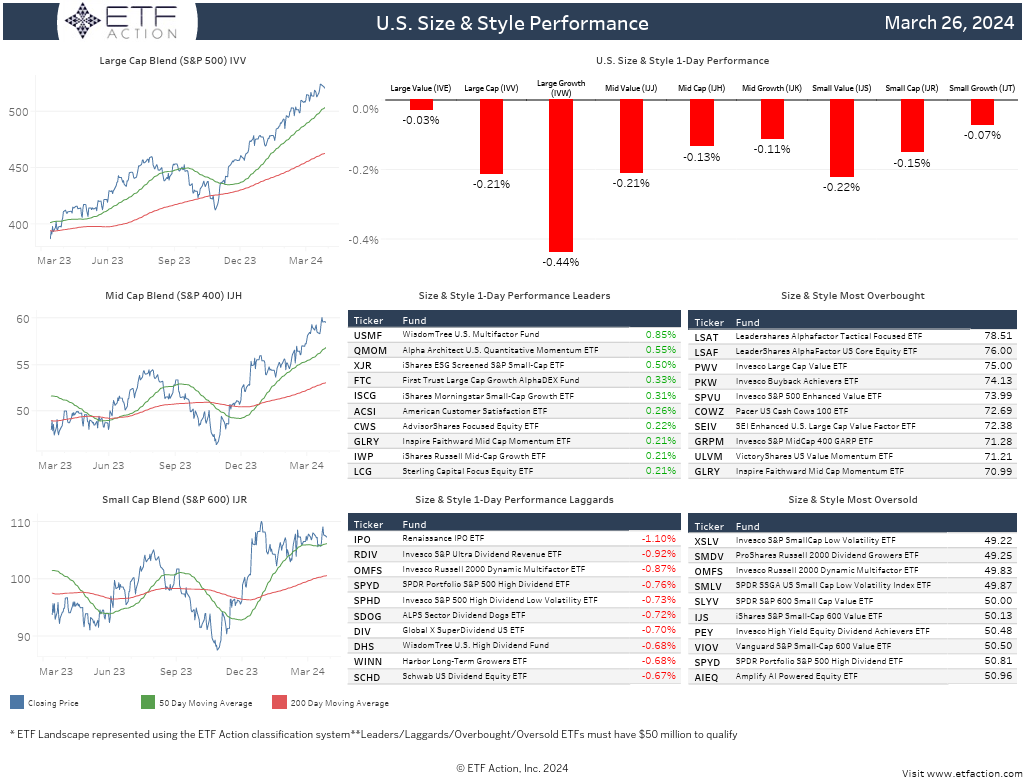
Daily Note
3.26.2024
Equities: Major averages saw modest losses on Monday following a strong week last week. The Dow Jones Industrial Average (DIA) slipped 40 bps, the NASDAQ 100 (QQQ) declined 36 bps, and the S&P 500 (SPY) dipped 28 bps. All three major averages are on pace for the 5th consecutive winning month in March. Mid-Caps (IJH) also inched higher by 8 bps yesterday while Small-Caps (IJR) sank 21 bps. Boeing climbed 1.36% after the aerospace company said earlier on Monday that chief executive officer David Calhoun would step down at the end of 2024. Board chairman Larry Kellner will also step down in part of a broad management shakeup, the company added. Meanwhile, United Airlines slid more than 3% on the day after the Federal Aviation Administration said it would be heightening its scrutiny of the carrier after a series of safety incidents over the last few weeks. Separately, according to the National Association of Realtors, existing home sales surged 9.5% month-over-month in February to a seasonally adjusted 4.38 million units. It was the largest monthly gain since February 2023, but sales were still down 3.3% year-over-year. Inventory increased 10.3% year-over-year to 1.07 million, which represents a still low 2.9-month supply at the current sales pace. The Durable Goods Orders report and Consumer Confidence data will be released on Tuesday.
Most U.S. factor strategies finished lower on Monday as S&P 500 Growth (SPYG) fell 39 bps, S&P 500 Low Volatility (SPLV) sank 37 bps, and S&P 500 Momentum (SPMO) retreated 31 bps. S&P 500 Pure Value (RPV) saw the best returns amongst factors, rising 16 bps. Developed ex-U.S. Markets (EFA, -21 bps) were pulled lower by Japan (EWJ, -1.16%). Hong Kong (EWH) also declined 69 bps while South Korea (EWY) advanced 70 bps. Emerging Markets (EEM) added 7 bps on strength from Indonesia (EIDO, +1.19%). Taiwan (EWT) increased 39 bps and China (MCHI) dropped 20 bps on the day.
Sectors: Energy (XLE) climbed 93 bps yesterday, bolstered by solid returns from Oil & Gas Exploration & Production (XOP, +1.10%) and Oil & Gas Equipment & Services (XES, +1.04%). XLE is the only sector currently sitting in overbought territory. Utilities (XLU) and Materials (XLB) were the only other U.S. sectors to see gains on Monday, adding 47 bps and 3 bps, respectively. Technology (XLK, -66 bps) and Industrials (XLI, -65 bps) were the worst performing sectors while Financials (XLF) and Real Estate (XLRE) each fell 39 bps. Communication Services (XLC), Consumer Discretionary (XLY), and Consumer Staples (XLP) were all down around 30 bps.
Themes: After gaining nearly 19% last week, Cannabis (MJ) dropped 5.43% to kick off the week. Biotech (SBIO) slipped 1.49% and Solar (TAN) declined 1.32% while Water (PHO) and Advanced Materials (REMX) each fell around 1%. Smart Infrastructure (GRID) also dipped 29 bps but remains in overbought territory. Blockchain (BLOK) surged 4.10% on the day, outgaining other global thematic segments. Disruptive Tech (ARKW) advanced 2.80%, Multi-Theme (ARKK) increased 1.70%, FinTech (FIXN) rose 1.14%, and Mobile Payments (IPAY) jumped 1.03%. BLOK and ARKW each hit new 52-week highs yesterday and BLOK is trading 42.56% above its 200-day moving average.
Commodities & Yields: Broad Commodities (DJP) were up 65 bps on Monday as all broad-based sectors registered positive returns. Energy (DBE) climbed 1.05% while Agriculture (DBA) jumped 2.33%. WTI Crude Oil (USO) increased 1.41%, Gold (GLD) added 32 bps, and Soybeans (SOYB) rose 79 bps. The U.S. Dollar (UUP) fell 25 bps, U.S. Aggregate Bonds (AGG) dipped 18 bps, and 20+ Year Treasury Bonds declined 50 bps. At yesterday’s close, the U.S. 2-Year Treasury Yield stood at 4.587% and the U.S. 10-Year Treasury Yield stood at 4.253%.
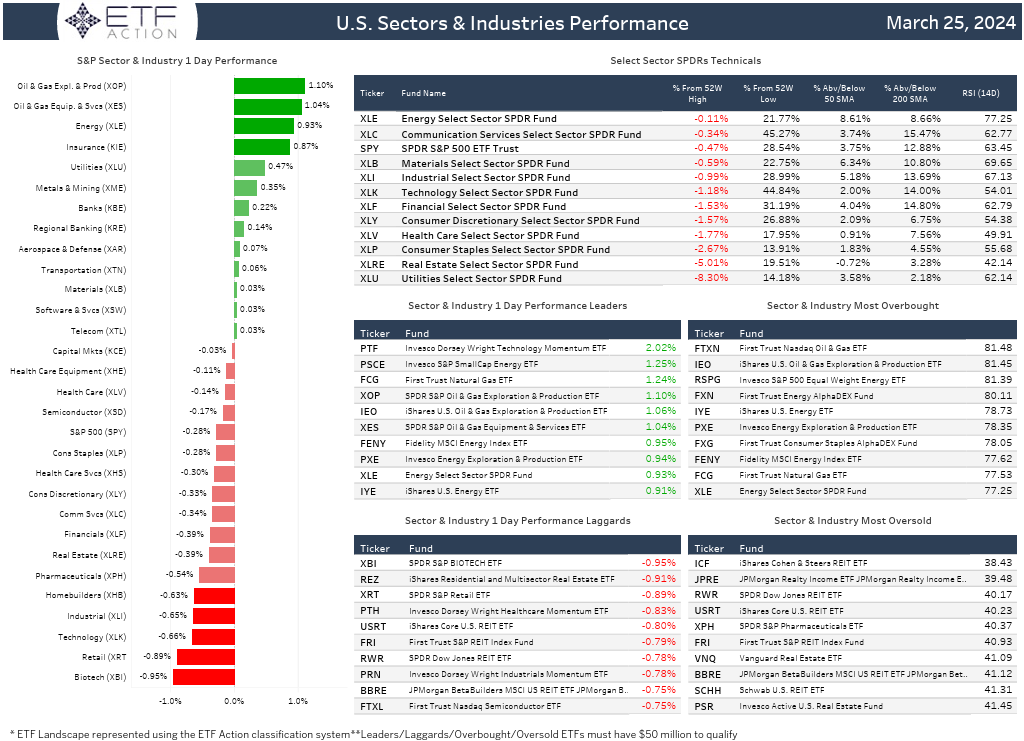
U.S. Mid Cap Equity Category Report
3.26.2024
- U.S. Mid-Cap Equity ETFs gathered $2.14 billion in net inflows in February and $13.22 billion over the past year
- The SPDR Portfolio S&P 400 Mid Cap ETF (SPMD) and the Invesco S&P MidCap Quality ETF (XMHQ) have each gathered more than $1 billion in net inflows in the past 3 months while the Vanguard Mid-Cap Value ETF (VOE) saw $891 million in net outflows in the period
- The iShares Core S&P Mid-Cap ETF (IJH) and the Vanguard Mid-Cap ETF (VO) are the largest ETFs in the category with $79.9 billion and $61.4 billion, respectively, in assets under management
- The average expense ratio of the 89 U.S. Mid-Cap Equity ETFs in the category is 36 bps, the average lifespan is 9.65 years, and the average TTM yield is 1.08%
- 32 ETFs in the category have low liquidity ratings and 26 ETFs have below average liquidity ratings, average ADV is $20.02 million
- The average 1-month return in February was +4.11%, average year-to-date return was +4.47%
- The Invesco S&P MidCap Momentum ETF (XMMO) and the Alger Mid Cap 40 ETF (FRTY) each climbed more than 14% last month
- Average top 10 holdings weight for the category is 16.96%
- Top average sector exposure for the category is Industrials (21.3%), Consumer Discretionary (14.4%), Financials (14.2%), and Technology (14.1%)
- The majority of the category has high or above average value ratings, average price to earnings (TTM) is 19.21
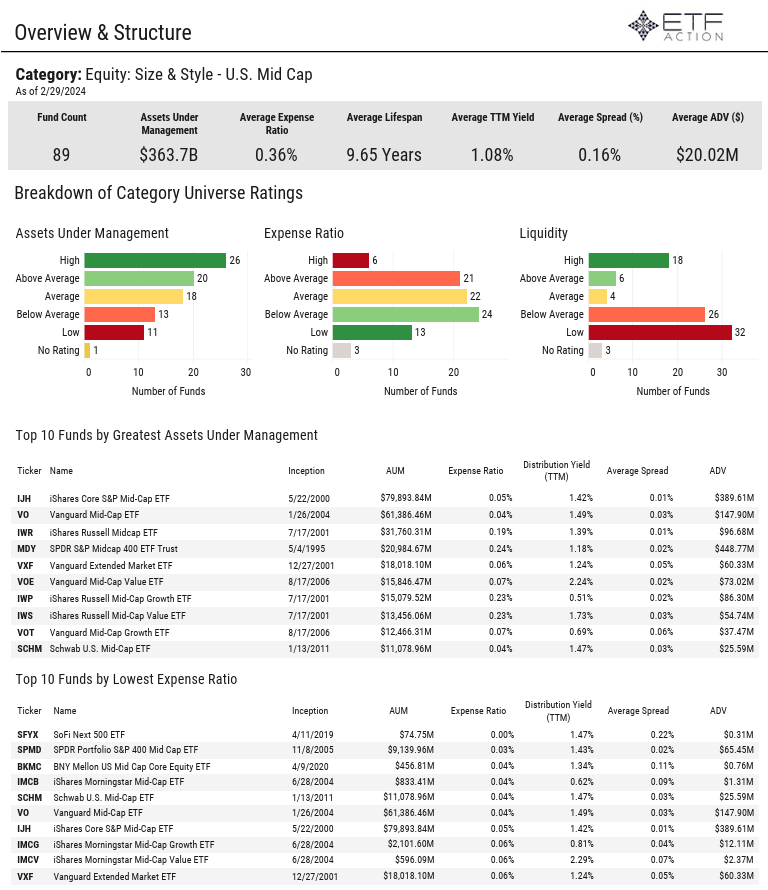
Daily Note
3.25.2024
Equities: The NASDAQ 100 (QQQ) added 11 bps to hit new 52-week highs on Friday while the Dow Jones Industrial Average (DIA) and the S&P 500 (SPY) slipped 81 bps and 19 bps, respectively. All three major averages saw solid gains last week with QQQ climbing 3.01%, SPY rising 2.23%, and DIA advancing 1.95%. Year-to-date, SPY is up 10.00%, QQQ has increased 9.14%, and DIA has gained 5.16%. Investors continued to digest the Federal Reserve’s decision to keep rates unchanged and commentary that reinforced the plan for several rate cuts this year. Additionally, investors weighed fresh earnings results on Friday. FedEx jumped more than 7% after posting adjusted earnings that beat analyst estimates. Lululemon plunged nearly 16% after issuing disappointing guidance. The retailer topped earnings estimates but said it’s seeing soft sales in the U.S., its largest market. Nike also declined 6.90% on Friday after reporting that its growth in China continued to slow. Nike topped estimates on the top and bottom lines for the holiday quarter but sales in China came in just below expectations. This week, investors will be looking towards New Home Sales figures, Durable Goods Orders numbers, Consumer Confidence data, an update on Gross Domestic Product (GDP) figures, and the Personal Consumption Expenditures (PCE) Index report.
S&P 500 Growth (SPYG, +22 bps) and S&P 500 Momentum (SPMO, +10 bps) were the only U.S. factor strategies in the green on Friday. S&P 500 Dividend (SPYD) and S&P 500 High Beta (SPHB) each dropped more than 90 bps while S&P 500 Pure Value (RPV) sank 77 bps. All factors finished higher last week with most rising more than 1.75%. SPHB, S&P 500 Pure Growth (RPG), SPYG, and SPMO) all climbed more than 3% on the week. Developed ex-U.S. Markets (EFA) dipped 21 bps on Friday as Hong Kong (EWH) declined 1.61% and South Korea (EWY) retreated 71 bps. Emerging Markets (EEM, -70 bps) were pulled lower by China (MCHI, -1.42%), Brazil (EWZ, -1.29%), and South Africa (EZA, -1.27%). EFA added 95 bps last week while EEM increased 22 bps.
Sectors: Real Estate (XLRE) and Financials (XLF) underperformed on Friday, declining 1.18% and 1.15%, respectively. XLF was impacted by losses from Regional Banks (KRE, -2.16%), Banks (KBE, -1.94%), and Capital Markets (KCE, -1.59%). Consumer Discretionary (XLY) also dropped 87 bps, Materials (XLB) fell 62 bps, and Consumer Staples (XLP) decreased 49 bps. Just 3 sectors saw positive returns on Friday: Communication Services (XLC, +21 bps), Utilities (XLU, +14 bps), and Technology (XLK, +3 bps). XLC hit new 52-week highs. All sectors were in the red on Friday. Last week, XLRE sank 40 bps while all other sectors saw gains. XLC jumped 3.46%, Industrials (XLI) climbed 2.91%, and XLY advanced 2.84%. XLK was also up 2.25% on the week.
Themes: Cannabis (MJ) surged another 8.00% on Friday, handily outpacing other global thematic segments. MJ entered overbought territory but rocketed nearly 19% last week. Wind (FAN) was the only other segment in positive territory on Friday, adding just 13 bps. Advanced Materials (REMX) lagged other segments, slipping 2.99%. Genomics (ARKG), Multi-Theme (ARKK), and Clean Energy (PBW) all fell more than 2%. Biotech (SBIO) slid 1.85% while Blockchain (BLOK), Mobile Payments (IPAY), and FinTech (FINX) all declined around 1.60%. Most segments were higher last week. Solar (TAN) and Cloud Computing (SKYY) both gained more than 3% for the week while REMX was down almost 2%.
Commodities & Yields: The U.S. Dollar (UUP) increased 53 bps, U.S. Aggregate Bonds (AGG) added 32 bps), and 20+ Year Treasury Bonds (TLT) rose 96 bps on Friday. At the closing bell, the U.S. 2-Year Treasury Yield stood at 4.600% and the U.S. 10-Year Treasury Yield stood at 4.218%. Broad Commodities (DJP) declined 74 bps as Natural Gas (UNG) fell 1.37%, Gold (GLD) sank 80 bps, Copper (CPER) declined 1.65%, and Soybeans (SOYB) retreated 1.53%. GLD has climbed almost 7% in the past month.
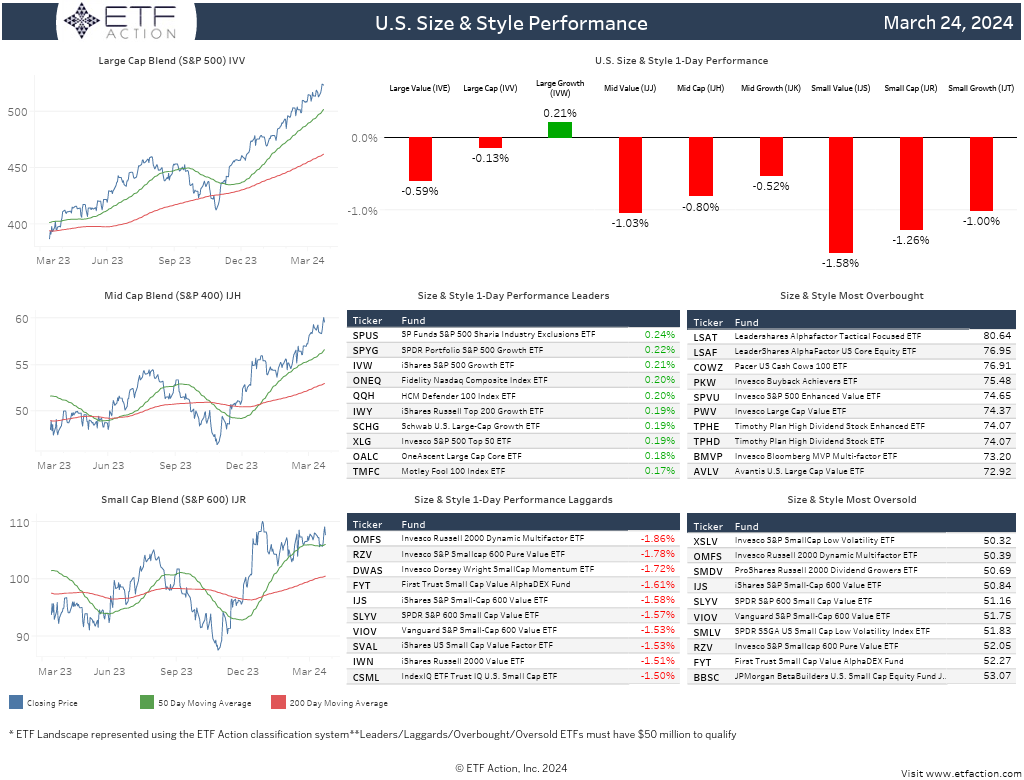
Materials Category Report
3.25.2024
- Materials ETFs saw nearly $800 million in net outflows in February and have seen $1.31 billion in net outflows year-to-date
- The Materials Select Sector SPDR Fund (XLB) saw $823 million in net outflows last month while the Vanguard Materials ETF (VAW) gathered $138 million in net inflows
- The VanEck Gold Miners ETF (GDX) is the largest ETF in the category with $10.8 billion in assets under management followed by XLB with $4.9 billion
- The category made up of 27 ETFs has $30.5 billion in total AUM, average expense ratio is 47 bps, average lifespan is 13.15 years, and average TTM yield is 1.57%
- The Fidelity MSCI Materials Index ETF (FMAT) is the cheapest ETF in the category with an expense ratio of 8 bps
- Most Materials ETFs were lower in February, the average 1-month return was -2.45% and the average year-to-date return was -7.78%
- The worst performer in January was the Amplify Junior Silver Miners ETF (SILJ, -12.65%), SILJ is down nearly 20% thus far in 2024
- The category has high volatility ratings with the 3-year average volatility vs S&P 500 (SPY) at 29.42%
- The average weight of top 10 holdings for ETFs in the category is 56.32% and the category has above average quality ratings
- The average price to earnings (TTM) for the cateogry is 16.54 and average return on equity is 9.7%
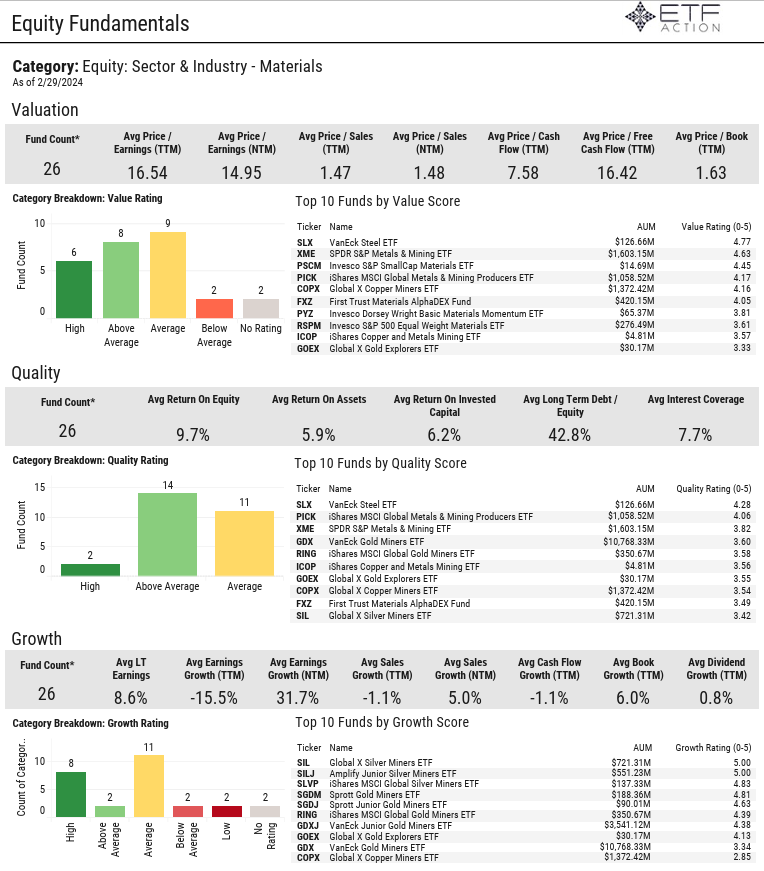
Daily Note
3.22.2024
Equities: The winning streak continued for U.S. equity markets on Thursday as the Dow Jones Industrial Average (DIA) rose 70 bps, the NASDAQ 100 (QQQ) gained 47 bps, and the S&P 500 (SPY) added 33 bps. All three major averages registered new 52-week highs and SPY and DIA are approaching overbought territory. Mid-Caps (IJH) also climbed 1.07% to new 52-week highs and Small-Caps (IJR) advanced 1.16%. Micron Technology surged more than 14% yesterday and notched its best day since December 2011 after reporting strong quarterly earnings results. Micron, which makes memory and storage solutions, reported that revenue increased to $5.82 billion from $3.69 billion one year ago. Meanwhile, Apple slumped more than 4% after the Department of Justice sued the tech giant on Thursday, saying that its iPhone ecosystem is a monopoly that drove its “astronomical valuation” at the expense of consumers, developers, and rival phone makers. Federal antitrust enforcement and 16 attorneys general also say that Apple’s anti-competitive practices extend beyond the iPhone and Apple Watch businesses, citing Apple’s advertising, browser, FaceTime, and news offerings. According to a report from the National Association of Relators released yesterday, existing home sales jumped 9.5% month-over-month in February to a seasonally adjusted 4.38 million units. Inventory also rose 5.9% year-over-year to 1.07 million homes and the median price increased 5.7% year-over-year to $384.5K. Federal Reserve Chairman Jerome Powell will make a speech on Friday.
All U.S. factor strategies finished higher once again yesterday, led by S&P 500 High Beta (SPHB, +1.29%), S&P 500 Pure Growth (RPG, +1.29%), and S&P 500 Enhanced Value (SPVU, +1.02%). S&P 500 Growth (SPYG) and S&P 500 Low Volatility (SPLV) lagged, each adding around 10 bps. Developed ex-U.S. Markets (EFA) dipped 5 bps on Thursday as France (EWQ) dropped 1.15% and Switzerland (EWL) fell 92 bps. South Korea (EWY) also increased 1.05%. Emerging Markets (EEM) advanced 12 bps despite losses China (MCHI, -87 bps) and Brazil (EWZ, -82 bps). Taiwan (EWT) was up 50 bps.
Sectors: Utilities (XLU) declined 16 bps on Thursday and was the lone U.S. sector in negative territory. Industrials (XLI) outgained other sectors, climbing 99 bps. Financials (XLF) rose 82 bps, Energy (XLE) and Consumer Discretionary (XLY) each added around 60 bps, and Materials (XLB) and Real Estate (XLRE) both advanced around 40 bps. XLF received a boost from Capital Markets (KCE, +1.75%), Regional Banks (KRE, +1.47%), and Banks (KBE, +1.45%) while XLRE was lifted by Homebuilders (XHB, +2.41%). Technology (XLK) and Communication Services (XLC) inched higher by 7 bps and 5 bps, respectively. XLB, XLC, XLF, XLI, and XLY all hit fresh 52-week highs. XLB, XLI, and XLE all sit in overbought territory.
Themes: Most global thematic segments posted gains yesterday with Cannabis (MJ, +3.31%) leading the charge. Water (PHO), Clean Energy (PBW), FinTech (FINX), and Mobile Payments (IPAY) all advanced more than 1% while Connectivity (FIVG) and Industrial Revolution (ARKQ) both climbed more than 90 bps. PHO and IPAY both entered overbought territory. Solar (TAN), Robotics & AI (ROBO), Multi-Theme (ARKK), and Disruptive Tech (ARKW) were all up more than 60 bps as well. Evolving Consumer (SOCL) trailed other segments, slipping 1.20%. Advanced Materials (REMX, -84 bps) and Wind (FAN, -68 bps) were also weak.
Commodities & Yields: U.S. Aggregate Bonds (AGG) added 7 bps, 20+ Year Treasury Bonds (TLT) rose 22 bps, and the U.S. Dollar (UUP) gained 68 bps yesterday. At Thursday’s closing bell, the U.S. 2-Year Treasury Yield stood at 4.632% and the U.S. 10-Year Treasury Yield stood at 4.271%. Broad Commodities (DJP, -38 bps) were dragged lower by WTI Crude Oil (USO, -56 bps), Silver (SLV, -2.75%), and Copper (CPER, -51 bps). Sugar (CANE) also climbed 1.52%.
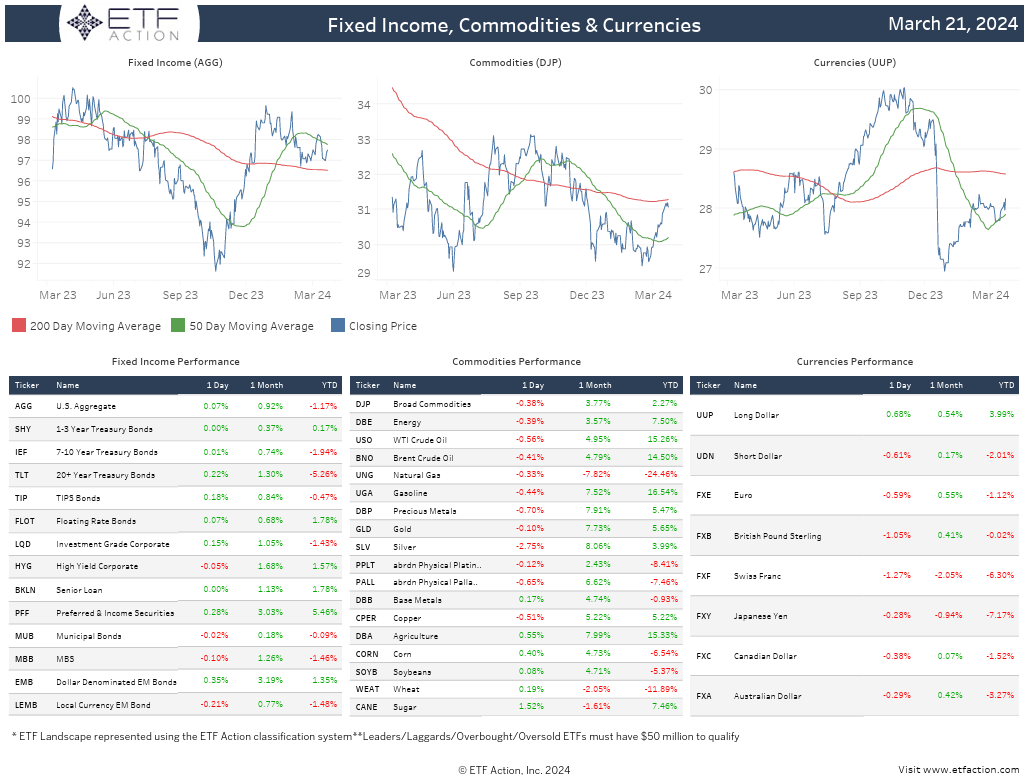
FI Multi Sector Category Report
3.21.2024
- There are 171 U.S. listed Multi-Sector Bond ETFs with nearly $456.9 billion in total assets under management
- The largest ETFs in the category are the Vanguard Total Bond Market ETF (BND) and the iShares Core U.S. Aggregate Bond ETF (AGG), each with over $100 billion in AUM
- AGG saw the largest new inflows in February with $2.6 billion and BND gathered $1.6 billion in
- Multi-Sector Bond ETFs have gathered $15.95 billion in net inflows year-to-date
- The average expense ratio of the category is 41 bps, the average lifespan is 5.20 years, and the average TTM Yield is 3.25%
- Notably, AGG and BND both have an expense ratio of 3 bps while the BNY Mellon Core Bond ETF (BKAG) has a 0 bps expense ratio
- 73 of the 171 ETFs in the category have low liquidity ratings and 42 have below average liquidity ratings, average ADV is $18.05 million
- Most Multi-Sector Bond ETFs posted losses in February, average 1-month return was -0.23%
- The Arrow Reserve Capital Management (ARCM) outperformed last month, climbing 4.14%
- The category has high exposure to Corporate Bonds, U.S. Government Bonds, and Mortgage Back Securities
- 87 of the 171 Multi-Sector Bond ETFs are U.S. focused and 74 are global
- The average YTM is 5.57% and the average effective maturity is 6.31 years
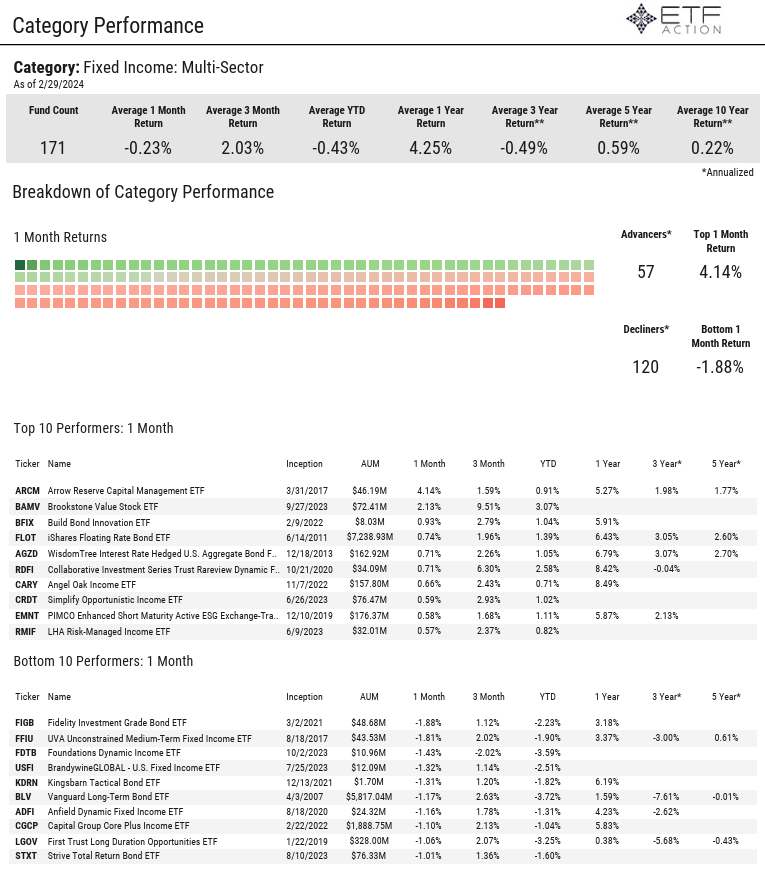
Daily Note
3.21.2024
Equities: U.S. equity markets registered positive returns on Wednesday after the Federal Reserve kept interest rates unchanged at the 5.25%-5.50% range and said it still plans to cut rates three times in 2024. The NASDAQ 100 (QQQ) climbed 1.19%, the Dow Jones Industrial Average (DIA) rose 1.05%, and the S&P 500 (SPY) gained 92 bps. Small-Caps (IJR, +1.65%) and Mid-Caps (IJH, +1.36%) were also strong yesterday. SPY, DIA, and IJH all hit fresh 52-week highs. Following its 2-day policy meeting, the central bank’s rate-setting Federal Open Market Committee (FOMC) announced yesterday that it will maintain rates at 23-year highs. Fed Chairman Jerome Powell also stated that the committee needs greater evidence that inflation is easing before it starts cutting rates. According to the CME FedWatch Tool, there is a currently just a 7.7% probability of a rate cut at the May FOMC meeting, but there is a 76.6% probability of a rate cut at the June FOMC meeting. Separately, Chipotle Mexican Grill jumped nearly 3.5% on Wednesday after announcing a 50-to-1 stock split. Paramount Global also surged almost 12% following a report that Apollo Global Management offered $11 billion for its film and TV studio. On Thursday, investors will be looking towards Jobless Claims data, the Philadelphia Fed Manufacturing Index results, and Existing Home Sales figures.
All U.S. factor strategies were in the green yesterday. S&P 500 High Beta (SPHB) jumped 2.19% and was the top performer. S&P 500 Pure Value (RPV), S&P 500 Pure Growth (RPG), S&P 500 Growth (SPYG), S&P 500 Momentum (SPMO), and S&P 500 Dividend (SPYD) were all up over 1% as well. Emerging Markets (EEM) rose 1.13%, lifted by South Africa (EZA, +3.25%), Mexico (EWW, +2.80%), Brazil (EWZ, +2.31%), and China (MCHI, +1.00%). Developed ex-U.S. Markets (EFA, +1.06%) were boosted by solid returns from South Korea (EWY, +2.37%), the Netherlands (EWN, +1.57%), and France (EWQ, +1.53%). EFA hit fresh 52-week highs.
Sectors: Health Care (XLV) and Energy (XLE) were the only U.S. sectors to post losses yesterday, slipping 23 bps and 14 bps, respectively. Consumer Discretionary (XLY) outperformed, advancing 1.49%, while Industrials (XLI), Financials (XLF), and Communication Services (XLC) all rose around 1,20%. XLF was bolstered by Regional Banks (KRE) and Banks (KBE), which both climbed around 3%. Technology (XLK) also gained 1.12% and Materials (XLB) increased 1.00%. Semiconductors (XSD, +2.34%) lifted XLK while Metals & Mining (XME) lifted XLB. XLC, XLF, XLI, and XLB all hit fresh 52-week highs on the day. Real Estate (XLRE, +41 bps) and Consumer Staples (XLP,+30 bps) also saw moderate gains.
Themes: All global thematic segments were in the green on Wednesday, except for Digital Infrastructure (SRVR, -24 bps). Blockchain (BLOK) jumped 5.41% and Clean Energy (PBW) climbed 4.08% from 52-week lows. Disruptive Tech (ARKW), Advanced Materials (REMX), Multi-Theme (ARKK), and Online Retail (IBUY) were all up more than 3.45% while FinTech (FINX) rose 2.90%, Mobile Payments (IPAY) increased 2.43%, Solar (TAN) was up 2.42%, and Evolving Consumer (SOCL) advanced 2.41%. BLOK, IBUY, and IPAY each hit new 52-week highs. Water (PHO) added 74 bps and was the only segment to gains less than 1%, besides SRVR.
Commodities & Yields: U.S. Aggregate Bonds (AGG) rose 21 bps, Preferred & Income Securities (PFF) gained 50 bps, and the U.S. Dollar (UUP) declined 46 bps on Wednesday. At yesterday’s closing bell, the U.S. 2-Year Treasury Yield stood at 4.604% and the U.S. 10-Year Treasury Yield stood at 4.271%. Broad Commodities (DJP) added 27 bps on solid returns from Precious Metals (DBP, +1.45%) and Agriculture (DBA, +1.02%). Gold (GLD) gained 1.19%, Silver (SLV) surged 2.19%, and Soybeans (SOYB) advanced 1.75%. Energy (DBE) also fell 1.22% as WTI Crude Oil (USO) and Natural Gas (UNG) were each down more than 1%.
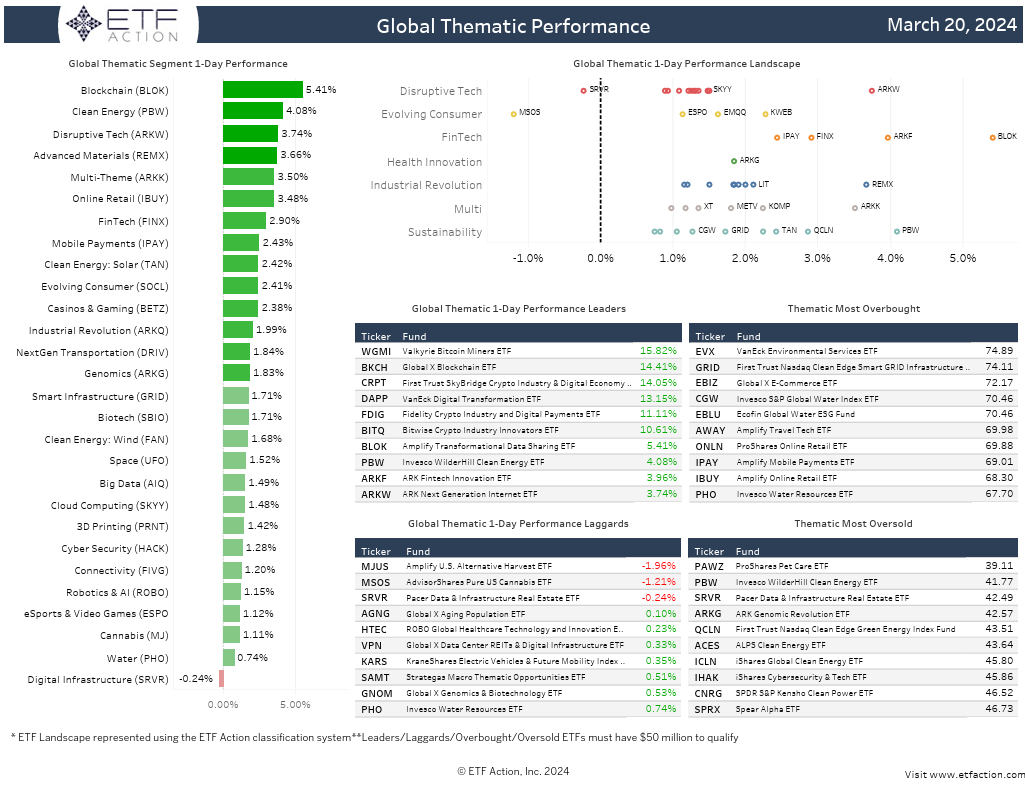
Natural Resources Category Report
3.20.2024
- Natural Resources ETFs saw $440 million in net outflows in February and $1.26 billion in net outflows over the past year
- The SPDR S&P Global Natural Resources ETF (GNR) saw the largest net outflows on the month with $330 million
- The cateory is comprised of 40 ETFs with $24.2 billion total assets under management
- Just 7 ETFs in the category have more than $1 billion in AUM, the FlexShares Morningstar Global Upstream Natural Resources Index Fund (GUNR) is the largest with $6.2 billion followed by GNR with $3.4 billion
- The Defiance Next Gen H2 ETF (HDRO) is the cheapest ETF in the category with an expense ratio of 30 bps
- The average expense ratio of the category is 57 bps, the average lifespan in 8.29 years, and the average TTM Yield is 2.18%
- 22 of the 40 Natural Resources ETFs have low liquidity ratings, average ADV ($) for the category is $6.19 million
- Natural Resources ETFs were mixed in February, average return was +0.43%, average YTD return was -5.14%
- The Sprott Junior Uranium Miners ETF (URNJ, -10.56%) was the worst performer last month
- The Range Nuclear Renaissance Index ETF (NUKZ), the iShares Lithium Miners and Producers ETF (ILIT), and the Sprott Lithium Miners ETF (LITP) all rose more than 7% on the month
- The category has high and above average volatility ratings relative to the S&P 500 (SPY), the average 3-year volatility relative to SPY was 24.80%
- The category has high average sector exposure to Materials (40.0%), Industrials (24.4%), and Energy (18.3%)
- Natural Resources ETFs have diverse geographic exposure, average exposure to Developed ex-U.S. markets is 47.36%
- The cateogry has above average value ratings and average quality ratings
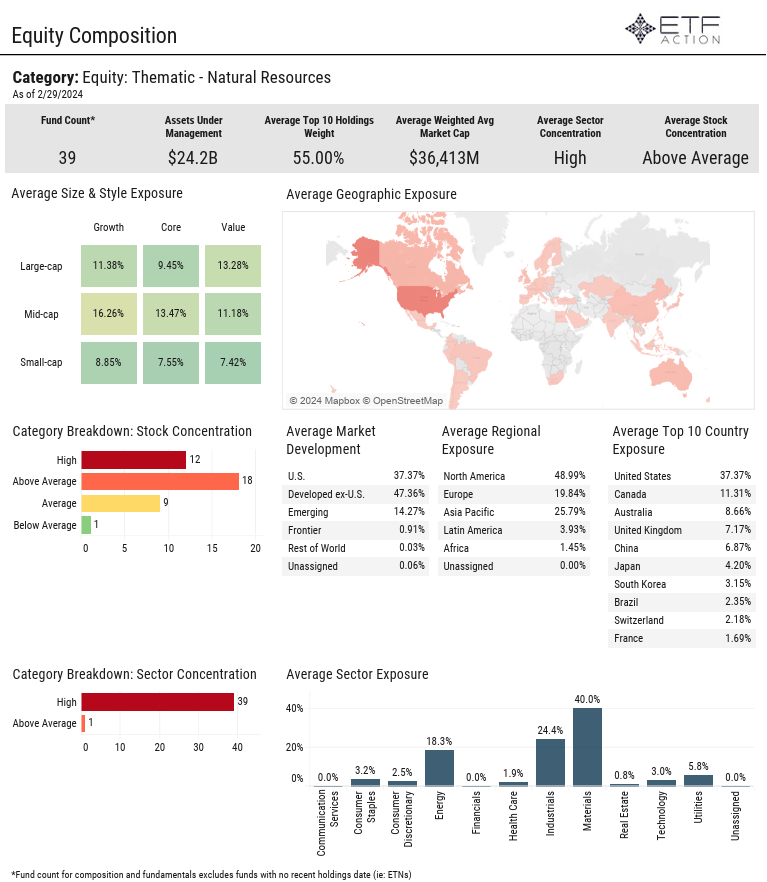
Daily Note
3.20.2024
Equities: Ahead of Wednesday’s interest rate decision by the Federal Open Market Committee (FOMC), major averages posted gains for the second consecutive session on Tuesday. The Dow Jones Industrial Average (DIA) advanced 82 bps, the S&P 500 (SPY) added 56 bps, and the NASDAQ 100 (QQQ) increased 25 bps. Mid-Caps (IJH) and Small-Caps (IJR) were also up 79 bps and 69 bps, respectively. The March FOMC meeting kicked off on Tuesday and the Federal Reserve is widely expected to keep rates unchanged on Wednesday. However, recent inflation reports have prompted concern from investors that the central bank could keep rates elevated longer than expected. U.S. single-family homebuilding rebounded sharply in February, hitting the highest level in nearly two years, according to a report from the Commerce Department released on Tuesday. Housing starts totaled a seasonally adjusted 1.521 million on the month, up 10.7% from January and 5.9% from a year ago. Total permits hit 1.518 million, a 1.9% increase from February and 2.4% from a year ago. Nvidia climbed more than 1% yesterday after announcing a new generation of artificial intelligence chips and software for running AI models. Chip competitor Advanced Micro Devices dropped nearly 5% following the announcement.
All U.S. factor strategies finished higher once again yesterday led by S&P 500 Minimum Variance (SPMV, +80 bps), S&P 500 Pure Value (RPV, +73 bps), and S&P 500 Momentum (SPMO, +70 bps). S&P 500 Growth (SPYG) also rose 58 bps, S&P 500 Dividend (SPYD) gained 48 bps, and S&P 500 High Beta (SPHB) advanced 29 bps. Emerging Markets (EEM) slipped 49 bps on Tuesday as Mexico (EWW) and India (INDA) both dropped more than 1%. China (MCHI) also fell 62 bps. Developed ex-U.S. Markets (EFA) increased 18 bps with the Netherlands (EWN) up 62 bps and South Korea (EWY) sinking 73 bps.
Sectors: Energy (XLE) climbed 1.114% and outpaced other U.S. sectors yesterday. XLE was bolstered by Oil & Gas Equipment & Services (XES, +2.32%) and Oil & Gas Exploration & Production (XOP, +1.29%). Utilities (XLU), Consumer Discretionary (XLY), and Industrial (XLI) all rose more than 85 bps while Health Care (XLV) gained 66 bps. XLI registered new 52-week highs. Technology (XLK) and Financials (XLF) were both up around 50 bps and Consumer Staples (XLP) increased 37 bps. XLK was impacted by Semiconductors (XSD, -65 bps), which was the only industry in negative territory on Tuesday. After outperforming on Monday, Communication Services (XLC) was the lone sector in the red, dipping 4 bps.
Themes: Global thematic segments were mixed on Tuesday. Blockchain (BLOK) and Advanced Materials (REMX) underperformed other segments, both slipping more than 1.50%. Disruptive Tech (ARKW) and Cannabis (MJ) each dropped more than 1.00%, FinTech (FINX) fell 75 bps, and Evolving Consumer (SOCL) declined 70 bps. Clean Energy (PBW) also dipped 19 bps to new 52-week lows. Yesterday was the 7th consecutive losing session for PBW. Biotech (SBIO) saw the strongest returns, adding 1.65%. Water (PHO) also jumped 1.43% and hit new 52-week highs followed by Solar (TAN, +58 bps) and Genomics (ARKG, +43 bps).
Commodities & Yields: At yesterday’s close, the U.S. 2-Year Treasury Yield stood at 4.692% and the U.S. 10-Year Treasury Yield stood at 4.296%. U.S. Aggregate Bonds (AGG) increased 25 bps, Preferred & Income Securities (PFF) rose 47 bps, and the U.S. Dollar (UUP) gained 25 bps. Broad Commodities (DJP) declined 24 bps on weakness from Industrial Metals (DBB, -94 bps) and Agriculture (DBA, -72 bps). Copper (CPER) sank 1.71%, Sugar (CANE) fell 1.98%, and Silver (SLV) dipped 52 bps.
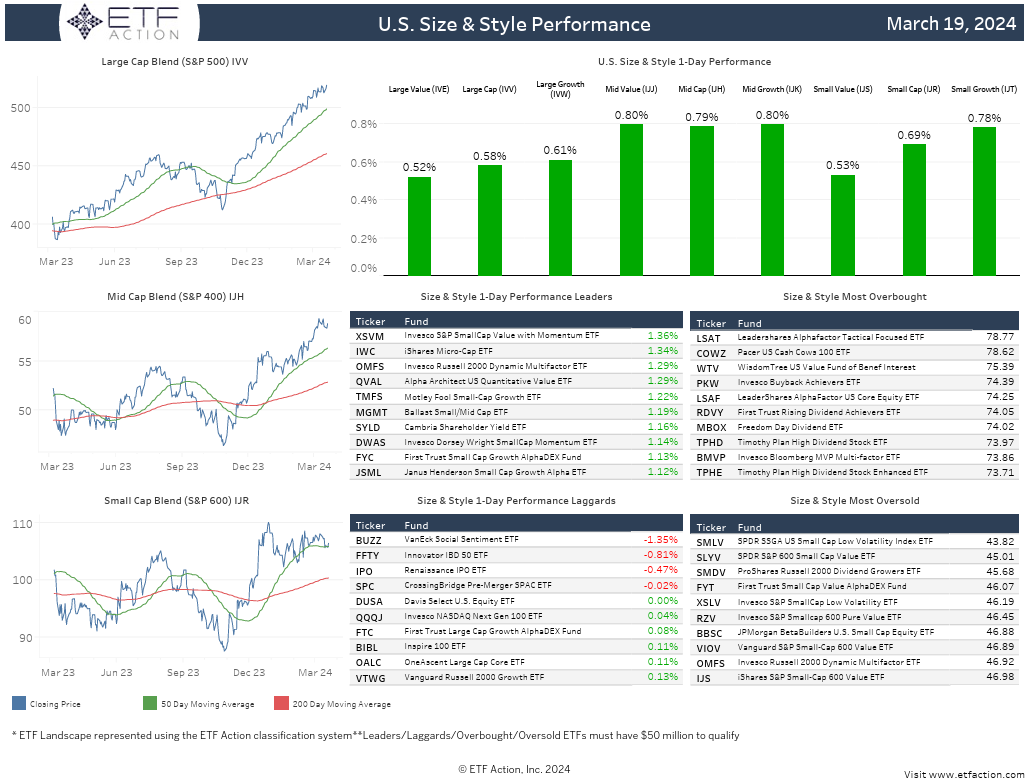
Global Equity Category Report
3.19.2024
- Global Equity ETFs gathered $1.16 billion in net inflows in February and $3.41 billion in net inflows over the past 3 months
- The JPMorgan Global Select Equity ETF (JGLO) gathered $1.07 billion in net inflows last month while the iShares MSCI ACWI ETF (ACWI) saw $413.5 million in net outflows
- The Vanguard Total World Stock ETF (VT) and ACWI are the largest ETFs in the category with $34.4 billion and $18.9 billion in AUM, respectively
- The average expense ratio of the 81 Global Equity ETFs in the category is 63 bps, the average lifespan is 5.14 years, and the average TTM yield is 1.40%
- Notably, 50 ETFs in the category have low liquidity ratings compared to 7 ETFs in the category with high liquidity ratings, average ADV for the category is $9.76 million
- The average 1-month return in February was +3.20%, average 1-year returns was +18.44%
- The top performing ETF in the category in February was the TCW Transform Systems ETF (NETZ, +9.25%), the worst perfromer was the Global X Superdividend ETF (SDIV, -3.86%)
- The average 3-year annualized return for the category is +2.93%
- The category is tilted towards large-cap names: 34.41% Growth, 19.86% Core, 14.86% Value
- The largest average sector exposure for the category is Technology (22.6%), Industrials (13.0%), and Financials (12.8%)
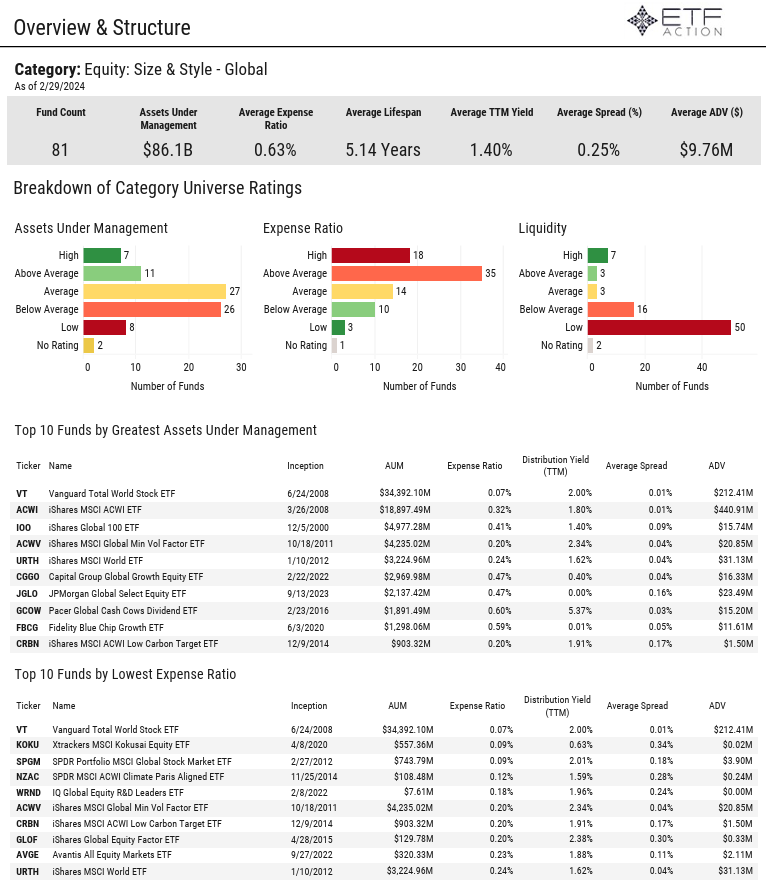
Daily Note
3.19.2024
Equities: As investors awaited the start of the Federal Open Market Committee (FOMC) meeting on Tuesday, U.S. equity markets started the week off strong with the NASDAQ 100 (QQQ) climbing 95 bps, the S&P 500 (SPY) gaining 59 bps, and the Dow Jones Industrial Average (DIA) adding 19 bps. Alphabet, Google's parent company, jumped more than 4.5% on the day after Bloomberg News reported that Apple was in talks with Google to include the company’s Gemini AI in iPhones. Apple’s next big iPhone update is expected during its Worldwide Developers Conference and Apple CEO Tim Cook said the company is “investing significantly” in AI during the company’s annual shareholder meeting in February. Separately, according to the National Association of Home Builders, homebuilder sentiment rose 3 points in March to 51. The reading gained for the fourth-straight month, hitting its highest level since July. Sentiment also moved into positive territory for the first time since July. The average rate on the popular 30-year fixed mortgage has hovered around 7% since early February. Housing Starts & Permits results will be released on Tuesday followed by the interest rate decision on Wednesday. According to the CME FedWatch Tool, there is just a 1.0% probability of a rate cut at the March meeting and 7.5% probability of a rate cut at the May meeting.
Growth-oriented pockets of the markets outperformed on Monday as S&P 500 Growth (SPYG) advanced 94 bps, S&P 500 Momentum (SPMO) rose, 72 bps, and S&P 500 Pure Growth (RPG) increased 60 bps. All other U.S. factors strategies were also in the green. S&P 500 Dividend (SPYD, +10 bps) and S&P 500 Pure Value (RPV, -17 bps) underperformed. Despite solid returns from Japan (EWJ, +1.55%), Developed ex-U.S. Markets (EFA) dipped 3 bps. Hong Kong (EWH) and Switzerland (EWL) fell 1.46% and 1.18%, respectively. Emerging Markets (EEM) added 17 bps yesterday with China (MCHI) gaining 62 bps and South Africa (EZA) declining 2.04%.
Sectors: All U.S. sectors registered positive returns yesterday, except for Real Estate (XLRE, -2 bps) and Health Care (XLV, -1 bps). XLV was dragged lower by Biotech (XBI, -1.88%) and Pharmaceuticals (XPH, -81 bps). Communication Services (XLC) was the best performing sector, jumping 2.05% to new 52-week highs. Consumer Discretionary (XLY, +76 bps), Consumer Staples (XLP, +64 bps), and Financials (XLF, +57 bps) followed. Technology (XLK) and Utilities (XLU) were both up around 50 bps while Energy (XLE) added 34 bps. Materials (XLB) and Industrials (XLI) each increased 18 bps. XLF, XLB, and XLI are all trading within 70 bps of 52-week highs.
Themes: After an excellent showing on Friday, Cannabis (MJ) outperformed other global thematic segments once again on Monday, surging another 6.45%. Cloud Computing (SKYY) and Evolving Consumer (SOCL) both rose more than 1.30% while Big Data (AIQ, +97 bps), Online Retail (IBUY, +82 bps), and Cyber Security (HACK, +76 bps) posted solid gains for the day. Biotech (SBIO) lagged other segments, sinking 2.46%. Space (UFO) also dropped 1.85%, Blockchain (BLOK) fell 1.24%), and Clean Energy (PBW) declined 1.20% to new 52-week lows. PBW is down nearly 28% year-to-date and almost 40% over the past year.
Commodities & Yields: Broad Commodities (DJP) added 58 bps yesterday on strength from Energy (DBE, +1.62%). WTI Crude Oil (USO) rose 2.16%, Natural Gas (UNG) increased 1.39%, and Gasoline (UNG) climbed 1.33%. Wheat (WEAT) was also up 2.35%. U.S. Aggregate Bonds (AGG) dipped 10 bps, 20+ Year Treasury Bonds (TLT) dropped 30 bps, and the U.S. Dollar (UUP) added 21 bps. At Monday’s closing bell the U.S. 2-Year Treasury Yield stood at 4.736% and the U.S. 10-Year Treasury Yield stood at 4.340%.
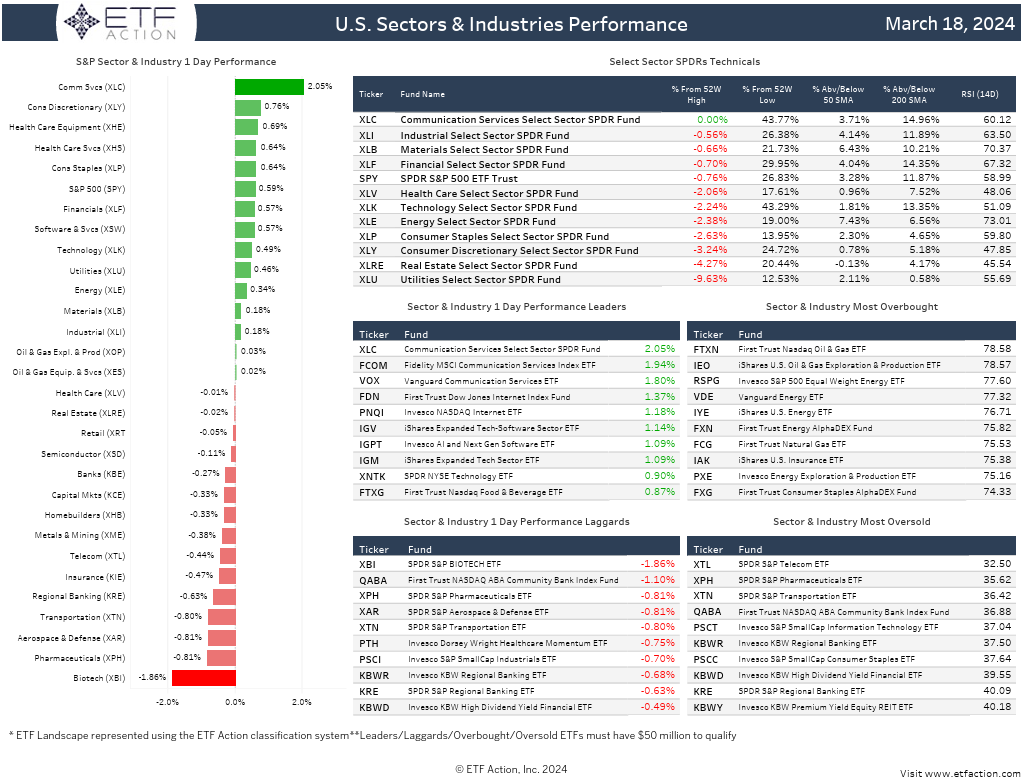
Daily Note
3.18.2024
Equities: On Friday, U.S. equity markets were lower once again with the NASDAQ 100 (QQQ) sinking 1.19%, the S&P 500 (SPY) falling 68 bps, and the Dow Jones Industrial Average (DIA) dropped 55 bps. Last week was another losing week for all three major averages. QQQ declined 1.16%, SPY was down 6 bps, and DIA dipped 1 bps. The Russell 2000 (IWM) added 19 bps on Friday but decreased more than 2% last week. Mega-cap tech names dragged markets lower on Friday as Amazon and Microsoft each declined more than 2% while Meta Platforms and Google-parent Alphabet each dropped more than 1%. Adobe plummeted 13.67% on the day after issuing weaker-than-expected quarterly revenue guidance. Investors also weighed consumer sentiment data from the University of Michigan, which came in slightly below expectations. The Survey of Consumers posted a reading of 76.5, down 0.4 points from February and missing the consensus estimate for 77.4. Inflation expectations were unchanged at both the 1-year and 5-year horizons, at 3% and 2.9%, respectively. The current conditions index also was unchanged at 79.4. This week, all eyes will be on the Federal Open Market Committee (FOMC) meeting beginning on Tuesday and the rate decision on Wednesday. Rates are widely expected to be unchanged this week. Housing Starts & Permits data and Existing Home Sales figures will also be released this week.
Most U.S. factor strategies saw losses on Friday with S&P 500 Growth (SPYG), S&P 500 Quality (SPHQ), and S&P 500 Pure Growth (RPG) all slipping at least 1%. S&P 500 Pure Value (RPV) gained 49 bps and S&P 500 Divided (SPYD) added 18 bps. Last week, factors were split. S&P 500 High Beta (SPHB) dropped 2.54% and was the worst performing factor. SPYD was also down 1.12% while S&P 500 Value with Momentum (SPVM) increased 1.09%. Developed ex-U.S. Markets (EFA) inched higher by 4 bps on Friday despite losses from South Korea (EWY, -2.18%) and Hong Kong (EWH, -85 bps). Japan (EWJ) climbed 74 bps. Emerging Markets (EEM, -61 bps) were pulled lower by South Africa (EZA, -1.14%) and Indonesia (EIDO, -1.05%). EFA and EEM dipped 45 bps and 12 bps, respectively, last week.
Sectors: Technology (XLK) declined 1.51% on Friday and lagged other U.S. sectors. Semiconductors (XSD, -78 bps) and Software & Services (XSW, -53 bps) were weak, impacting XLK. Communication Services (XLC) and Consumer Discretionary (XLY) both dropped 1.00% while Health Care (XLV) slid 40 bps. Financials (XLF, -10 bps), Real Estate (XLRE, -5 bps), and Consumer Staples (XLP, -4 bps) also saw modest declines. Energy (XLE) gained 30 bps and Utilities (XLU) rose 14 bps. XLE handily outgained other sectors last week, climbing 3.84%. Materials (XLB) also advanced 1.62%. XLRE retreated nearly 3% on the week while XLY sank 1.25% and XLK fell 83 bps. XSD plunged 5.66% last week and is now trading below its 50-day moving average.
Themes: After underperforming earlier in the week, Cannabis (MJ) surged 9.65% on Friday following news that the Drug Enforcement Agency would soon reclassify the cannabis to a lower-risk category. Blockchain (BLOK) and Biotech (SBIO) were also each up more than 1.30% and Advanced Materials (REMX) increased 72 bps. Cloud Computing (SKYY) lagged, dropping 1.73%. Big Data (AIQ) and Cyber Security (HACK) both declined 1.57% while Digital Infrastructure (SRVR) and 3D Printing (PRNT) each sank around 1%. MJ climbed more than 5% last week but is still down 4.48% over the past month. REMX also gained 1.59% on the week and Casinos & Gaming (BETZ) added 7 bps. All other global thematic segments were in the red last week with most falling more than 1.50%. Clean Energy (PBW) and Solar (TAN) both plummeted more than 7% and Genomics (ARKG) sank 6.35%.
Commodities & Yields: The U.S. Dollar (UUP) added 11 bps, U.S. Aggregate Bonds (AGG) dipped 1 bps, and Preferred & Income Securities (PFF) rose 22 bps on Friday. At the closing bell, the U.S. 2-Year Treasury Yield stood at 4.723% and the U.S. 10-Year Treasury Yield stood at 4.304%. Broad Commodities (DJP) added 23 bps on the day as Silver (SLV) gained 1.32%, Copper (CPER) climbed 1.98%, and Agriculture (DBA) jumped 2.17%. CPER is up nearly 10% in the last month and DBA has risen 8.21%.
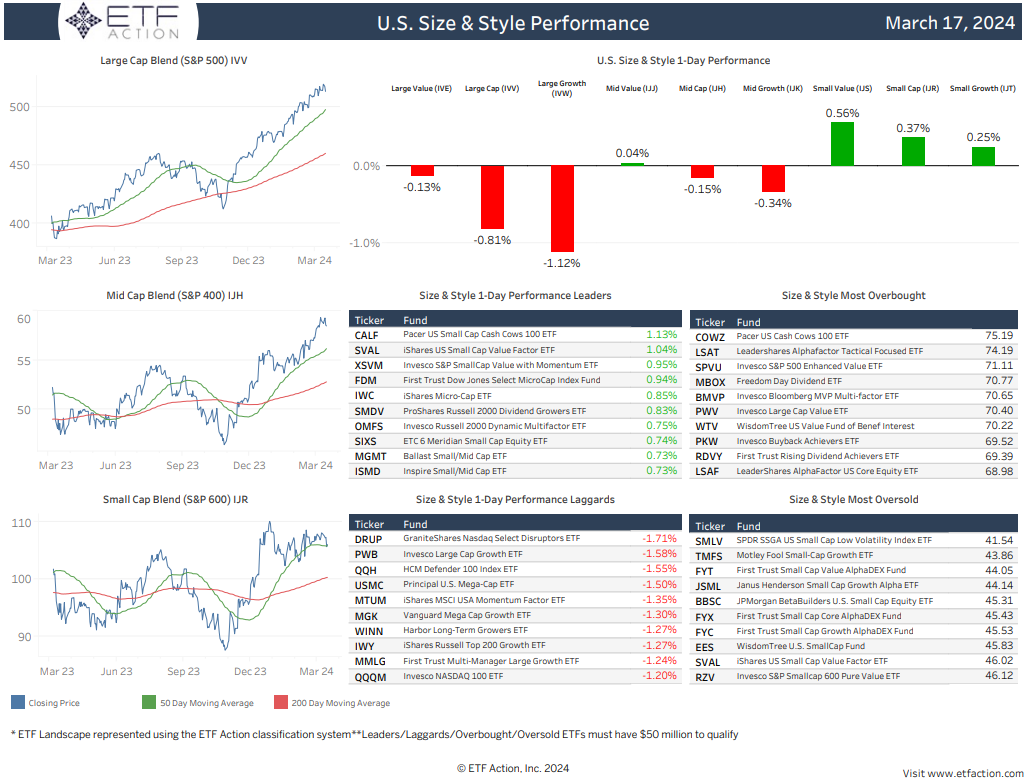
Financials Category Report
3.18.2024
- Financials ETFs saw $1.65 billion in net outflows in February but have gathered $1.32 billion in net inflows over the past 3 months
- The Financial Select Sector SPDR Fund (XLF) saw the largest net outflows in February with $787 million
- The SPDR S&P Bank ETF (KBE) and the SPDR S&P Regional Bank ETF (KRE) each saw more than $300 million in net outflows on the month
- The Financials category is comprised of 37 ETFs with $66.3 billion in total assets under management
- XLF is the largest ETF in the category with $37.2 billion in AUM
- The cheapest ETF in the category is the Gabelli Financial Services Opportunities ETF (GABF) with an expense ratio of 4 bps
- 13 of the 37 ETFs in the category have Low Liquidity ratings, average ADV for the category is $72.94 million
- 21 of the 37 Financials ETFs posted gains last month, average return was -0.07%
- The Invesco KBW Regional Banking ETF (KBWR) and KRE underperformed in February, both sinking more than 9%
- Average 3-month return for the category is +10.30% and average 1-year return is +8.11%
- The category has high/ above average value ratings and high/ above average volatility ratings