
AIM Portfolios: Evaluating Valuation Multiples
3.30.2021
AIM Portfolios: Evaluating Valuation Multiples
Overview
If you have taken a look at the ETF Action AIM Portfolio Positioning Guides, you may be aware that we score market segments using five primary critieria in calculating portfolio allocation weights: Macroeconomic, Fundamental (Quality & Growth), Relative Valuation, Momentum, and Timing. Each criterion is evaluated and included in the final allocation determination made by the ETF Action Investment Committee. Today we focus on the valuation component and what specifically we look at when determining relative valuation scores within a specified universe such as sectors and industries. Broad topics include:
Several Methods For Analyzing Valuation Multiples
1. Comparing Absolute Valuation Multiples
Using valuation multiples to compare how "cheap" or "expensive" a security may be is not new in the slightest. When evaluating a specific firm's valuation, it has been common practice to look at similar companies with common size, industry, capital structure, growth metrics, and more to help set an appropriate valuation range. This same practice can be used when evaluating ETFs because at the end of the day, ETFs are simply a sum of their parts.
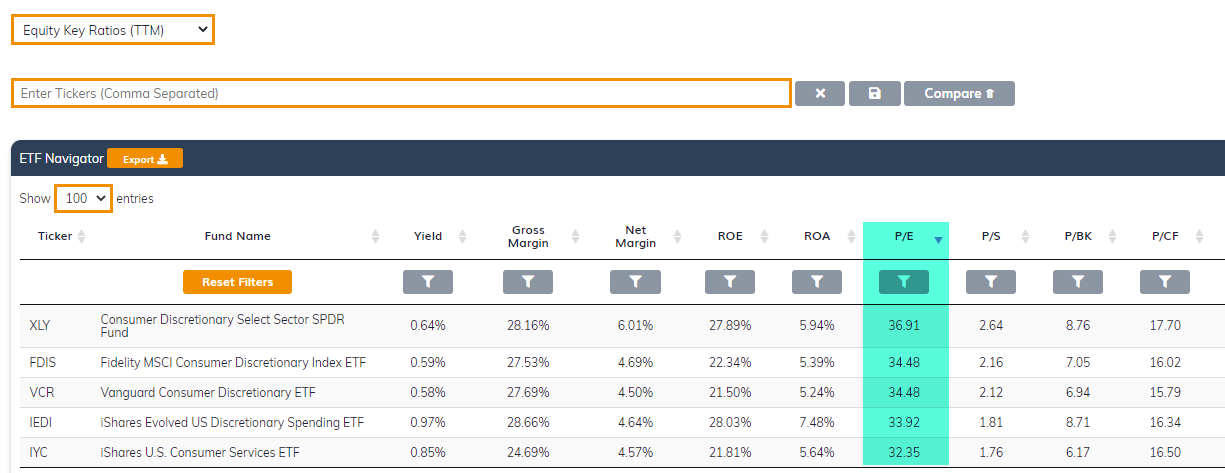
So for example, we could line up five different U.S. large-cap consumer discretionary ETFs in the ETF Action Terminal and look across their absolute valuation multiples to find which strategies appear cheaper or more expensive. This is particularly useful if our primary goal was to lower the absolute multiple of my portfolio in fear of rising interest rates (for example). While these valuatuion multiples are similar, there still are small differences which may be due to different portfolio metrics, weighting methodologies, etc.
Five U.S. large-cap consumer discretionary ETFs sorted by Price to Earnings multiples show dispersion in valuations among similar sector strategies.
 Source: ETF Action
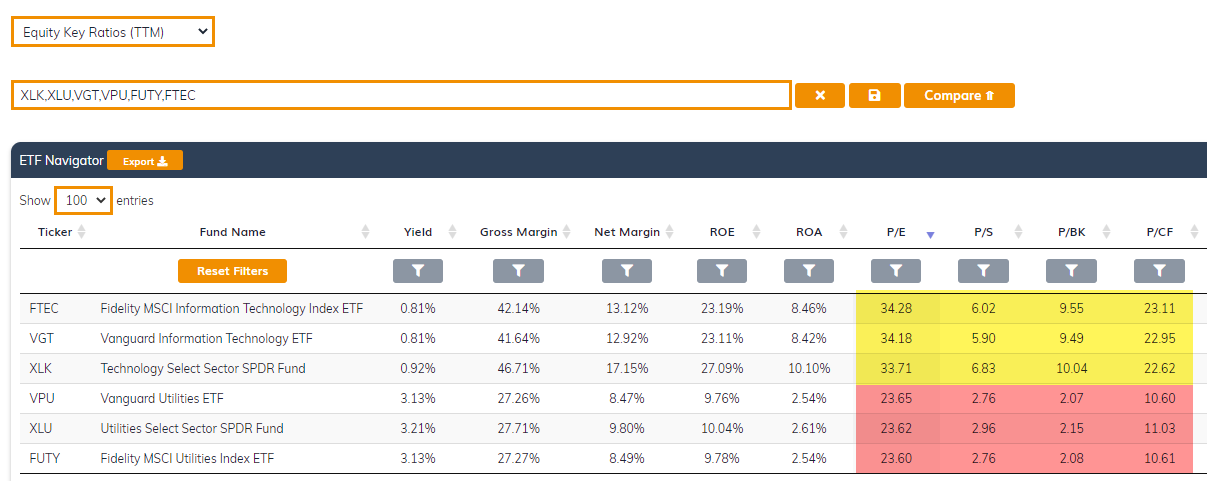
However, simply looking at absolute valuation methods such as price to earnings ratios or price to sales ratios across different sectors and industries is not so simple. If we were to compare a tech sector ETF against a utility sector ETF just by absolute valuation ratios, the tech sector ETF will always appear more expensive. Why? Inherently the tech sector trades at richer multiples because of the growth potential associated with these firms whereas utilities have a higher consistency of cash flow, lower growth metrics, and hence lower valuation multiples.
Comparing absolute valuation ratios across sectors and industries is not straight forward due to different growth and fundamental metrics. For example, tech sector strategies inherently have greater multiples than utility sector strategies but does that always make them more expensive?
 Source: ETF Action
2. Comparing Current Multiples To Historical Averages
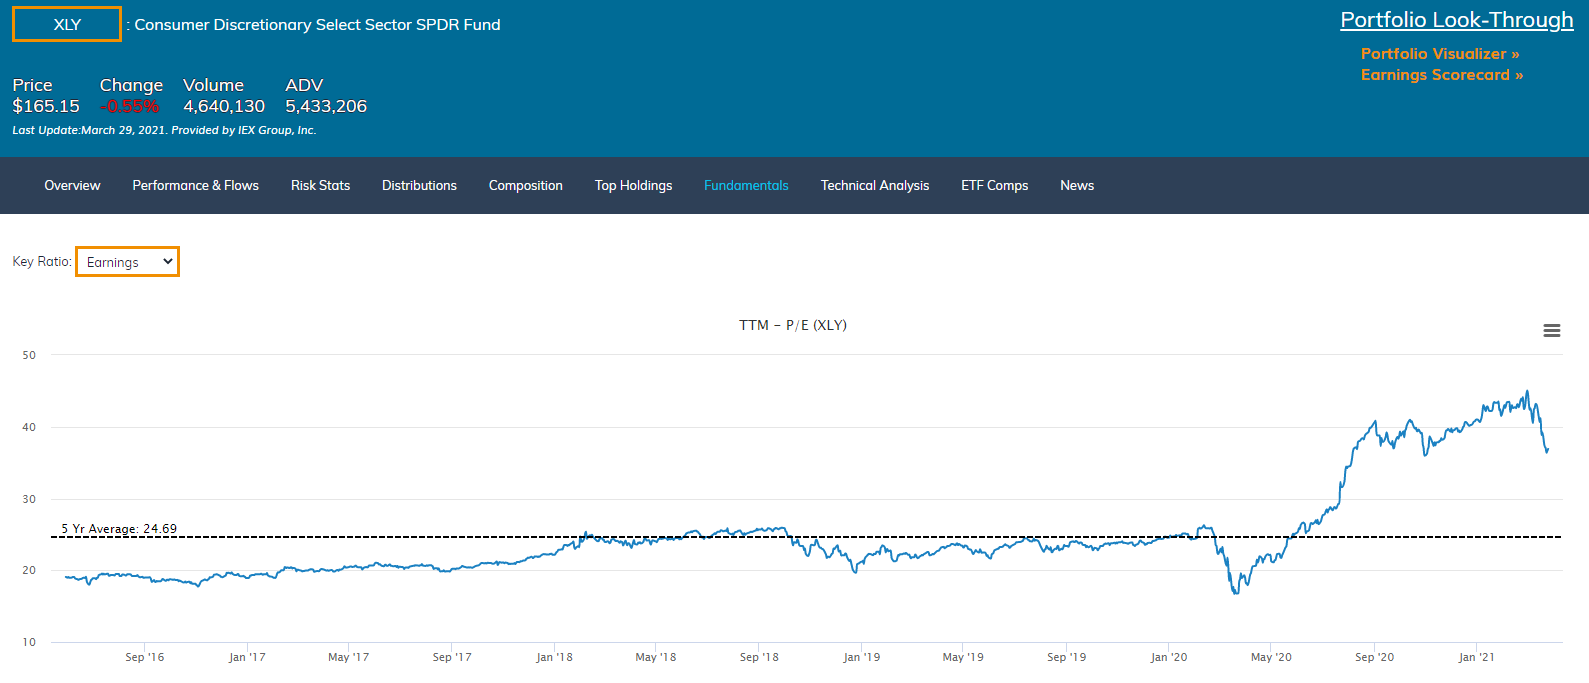
So if we cannot just line up different strategies across different industries, we then look to how a current portfolio matches up against its historical averages to see how far overextended it may be in one direction or the other. This is specifically why we have included the "Key Ratios vs. 5 Year Averages" data tab in the ETF Action Terminal. Using this tab, we are now looking at how much of a premium or discount a strategy currently has relative to its five year average (using the current stocks in the strategy retroactively to calculate 5 year average). In doing so, we now have an effective way of looking at valuation levels for strategies from many different sectors and industries at the same time. In addition, you can visualize one strategy relative to its five year average in the "Fundamentals" research frame.
Comparing strategies current valuation levels relative to its historical averages can also help determine how "cheap" or "expensive" it is. Below you can see the Consumer Discretionary Select Sector SPDR ETF (XLY) has risen well above (~50 premium%) its 5 year average P/E ratio.
 Source: ETF Action
Why ETF Action Uses A Multi-Faceted Approach
So there are several ways of looking at valuation levels but the question remains, what way is best? There are benefits from using each of the above methods but also drawbacks. To get the clearest picture possible, we use a combination of both approaches highlighted above with an added twist.
To begin, we should note that we use four inputs and average the results: price to earnings, price to sales, price to book, and price to cash flow. We first look across our universe of ETFs using the "Comparing Current Multiples To Historical Averages" technique (#2 above). This is straight forward and gives us a quick indication of premium/discounts relative to intermediate ranges.
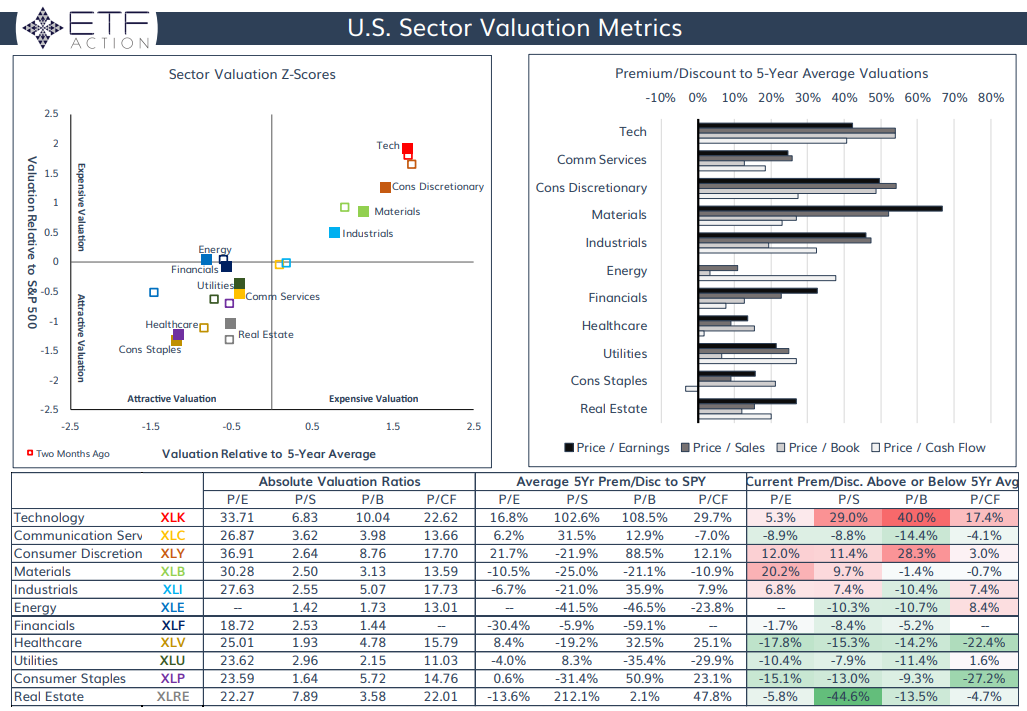
Second, we incorporate absolute valuation multiples but unlike the example in #1 above, we do so in relation the benchmark. We look at how a current sector or industry's multiple is in relation to the current multiple of the benchmark, and then compare that to the historical average of that relationship. Why? Using the example from earlier, we know that a tech strategy is going to be more expensive than a utilities strategy. However, by using the historical average premium tech has to utilities, we can now see if the current premium is more expensive than normal. (ie: The average premium of tech to the S&P 500 (SPY) is 16.8%. Currently it is trading 22.1% higher than SPY giving it a 5.3% premium.
Last, we oftentimes normalize the distribution of values and create z-scores in order to illustrate the data in an easy to interpret way. You may have seen some these charts in our weekly playbooks.
Using both valuation multiples relative to historical averages (top right) along with valuation multiples relative to a benchmark (table metrics) helps give us clearer picture. This technique is illustrated in the image below from this week's sector playbook.
 Source: ETF Action U.S. Sector Playbook
Thoughts, Considerations, & Conclusions
So that is a relatively quick explanation of how we are looking at valuation multiples here at ETF Action but keep in mind, it is not simply a "one size fits all" technique. There are nuances and special considerations to keep in mind depending on the segments you are looking at and data you are pulling. For example, we often put a much higher emphasis on price to sales ratios when comparing thematic strategies because of the lack of positive earnings and earnings consistency for smaller, more immature companies. We consider the implications of macroeconomic developments on current valuation levels (ie: near zero interest rates creating room for expanded valuation multiples).
Additionally, it is important to note that we are continuing to refine different ways of looking at the data in more effective ways which will ultimately help us position our strategies in areas of the market with attractive growth opportunities at reasonable valuation levels.
For more information, please reach out to team@etfaction.com
Alex Shepard is the COO & Director of Research at ETF Action. Inquiries can be sent to alex@etfaction.com
Important Disclosures
All ETF Action Model Portfolios are made available to subscribers for informational purposes only and do not represent actual investments. The opinons expressed herein are just that, and should not be construed as any type of investment advice. Full terms of service, including terms of use, copyrights, and disclaimers are available here.
To learn more about the ETF Action AIM Portfolios, please visit www.etfaction.com/models or reach out to team@etfaction.com.