
ETF All-Stars: Clean Energy
2.11.2021
Top 10 Clean Energy Stocks:
Looking Beyond Lofty Returns
In investing, it's a fine line between buzz and hype—and there's a lot of hype in clean energy these days. In the first six weeks of 2021 alone, more than $4.1 billion has flowed into clean energy ETFs—and about $8.2 billion since the 2020 election.
It's easy to see why. Climate change is a real and existential threat, one that has sparked an acceleration worldwide in the transition to cleaner energy sources, such as solar and wind. That in turn has sent demand skyrocketing for these clean energy companies' products and services.
Yet it's important not to get so swept up in the story that you lose track of fundamentals. While, as a theme, clean energy clearly has long-term growth potential, not every stock within that theme possesses an equally strong balance sheet, and some companies have a brighter future than others—no matter what their share prices today might suggest.
This week, thanks to a not-at-all scientific Twitter poll, we're digging into the ETF All-Stars® Clean Energy Select Top 10 List. These ten consensus stocks, culled from the equities most widely owned by clean energy ETFs, are mostly what you'd expect: solar panel makers, supplemented turbine manufacturers and next-gen utilities.
Returns-wise, they're all through the roof. But is that performance backed up by reality? We dig into the numbers below.
How We Determine The Top Clean Energy Stocks
Within the ETF Action Classification system, we classify 11 broad-based ETFs in our "Clean Energy: Broad-Based" group, from the $7.1 billion iShares Global Clean Energy ETF (ICLN) down to the SmartETFs Sustainable Energy II ETF (SULR). We've listed them in the table below:
Source: ETF Action
How We Did It: To export data on any list of ETFs, click the orange "Export" button at the top of the ETF Navigator.
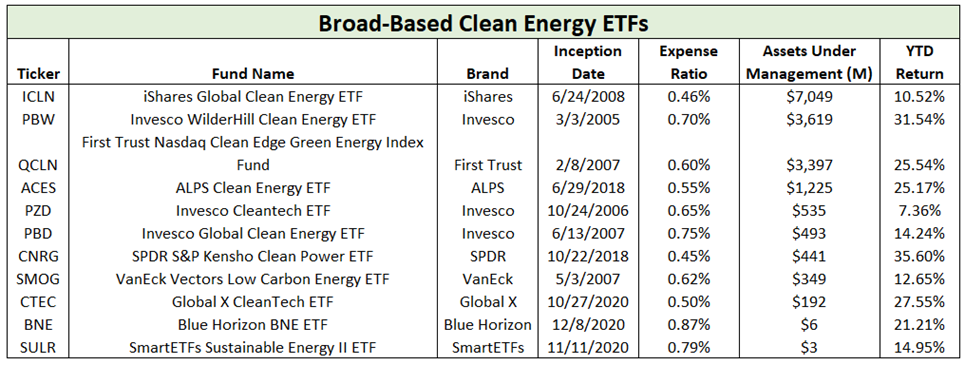
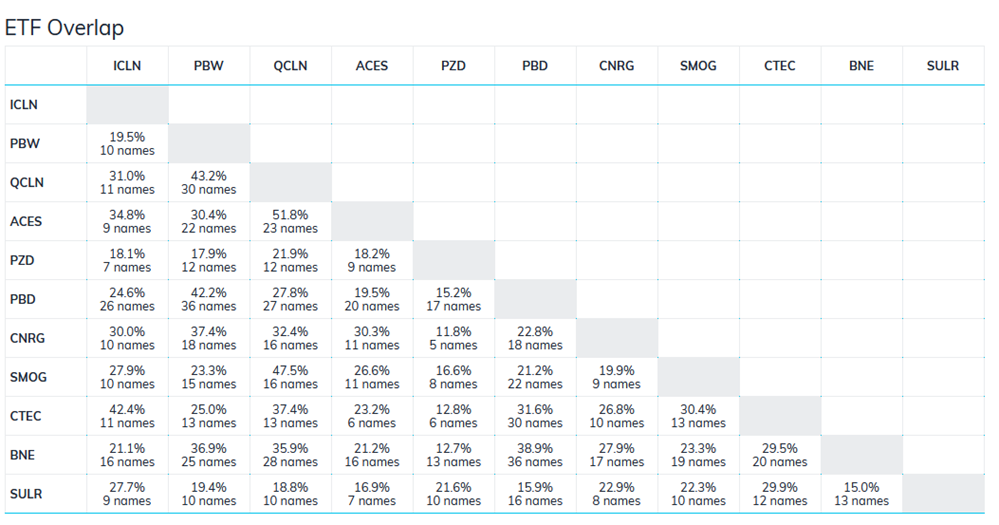
Together, these 11 ETFs, which comprise about $17 billion in assets under management, hold 245 unique stocks—meaning, there's plenty of room for differentiation. In fact, each of these funds tends to have low overlap with the others in the set: Although the highest portfolio overlap is between the ALPS Clean Energy ETF (ACES) and the First Trust Nasdaq Clean Edge Green Energy Index Fund (QCLN), at 51.8%, the average overlap between ETFs is much lower, at just 26.4%.
Source: ETF Action
How We Did It: Input ETF tickers into the ETF Overlap Analyzer to see an overlap matrix, including percentage overlap and total names in common.
Using this data, we can construct our ETF All-Stars® Clean Energy Select Top 10 List. This list is a ranking of the top ten most 'prevalent' stocks among these 11 clean energy ETFs. (See table below.) As a reminder, prevalence measures both a stock's occurrence rate and total market value held by the ETFs. For example, both Canadian Solar (CSIQ) and SunPower Corporation (SPWR) both appear in eight out of the 11 ETFs; but the funds hold $296 million of Canadian Solar, compared to $241 million of SunPower, so Canadian Solar has a higher ranking.
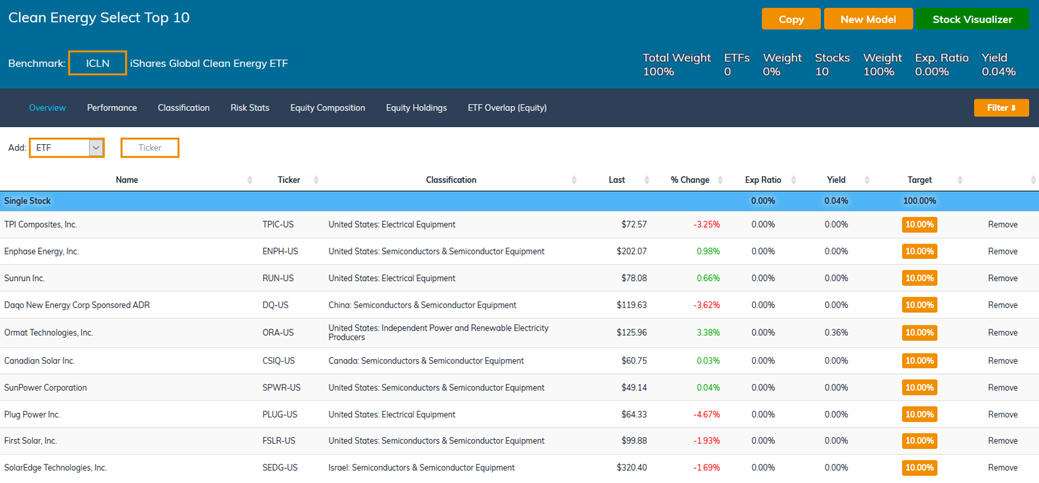
Source: ETF Action
How We Did It: Professional tier ETF Action subscribers can access this list via the Model Tracker: Select "ETF All-Stars Thematic Select Lists > Sustainability > Clean Energy Select Top 10."
Returns For Top Clean Energy Stocks Shine Bright
Out of these 245 stocks, there's one that appears in all 11 funds: Enphase Energy, Inc. (ENPH), a solar power and energy storage company based in California.
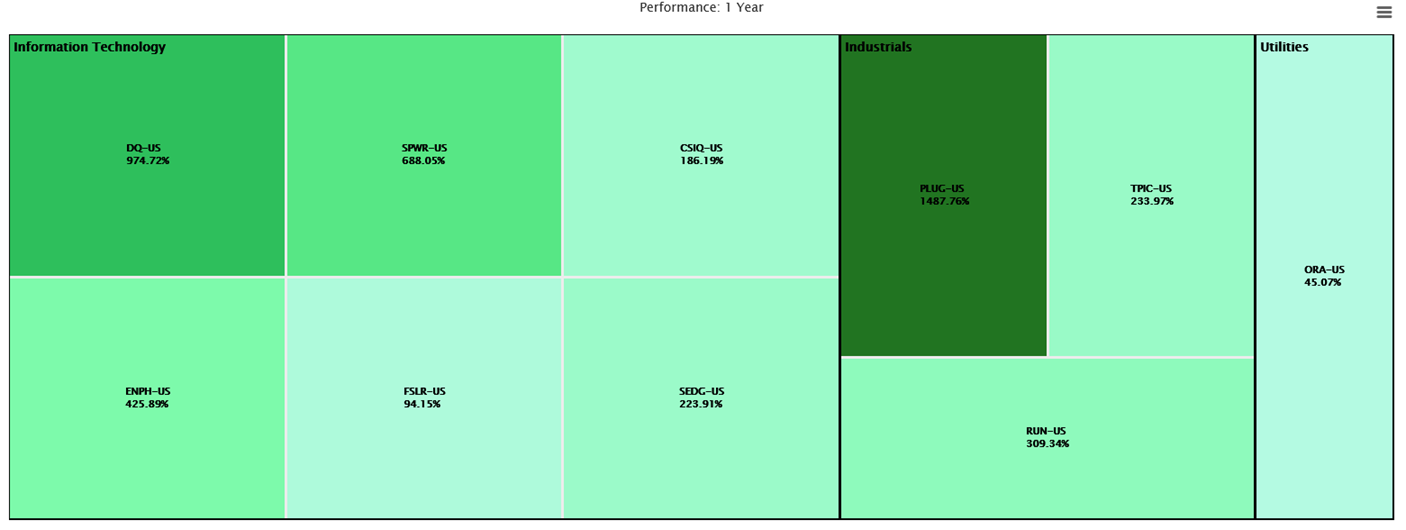
By objective standards, Enphase's 12-month return is the kind of track record investors dream of, rising a mind-boggling 426% over the past year. Yet, compared to the rest of the stocks in our ETF All-Stars® Clean Energy Select Top 10 List, Enphase's performance is actually middle of the road:
Source: ETF Action
How We Did It: Under the "Clean Energy Select Top 10", select the "Stock Visualizer" button, then set for the desired time frame.
Note: Requires Professional subscription
Those numbers aren't typos. SunPower Corp. (SPWR) is up 688.1% over the past 12 months. Daqo New Energy Corp. (DAQO) is up 974.7%. And Plug Power Inc (PLUG) is up an astonishing 1,487.8%.
Indeed, almost all the stocks in this list are posting returns in the stratosphere, with the exception of Ormat Technologies (ORA) and First Solar (FSLR), up 45% and 94%, respectively. But put that in perspective: In almost any other sector, these two would easily be the best one-year performers, by a long shot.
Top Clean Energy Stock Valuations A Mixed Bag
Yet there's more to the story than just lofty returns, of course. Below are price-to-sales (P/S) ratios for our ETF All-Stars® clean energy stocks. P/S ratios aren't the end-all, be-all of valuation metrics, of course; but for now, they serve as a handy starting point:
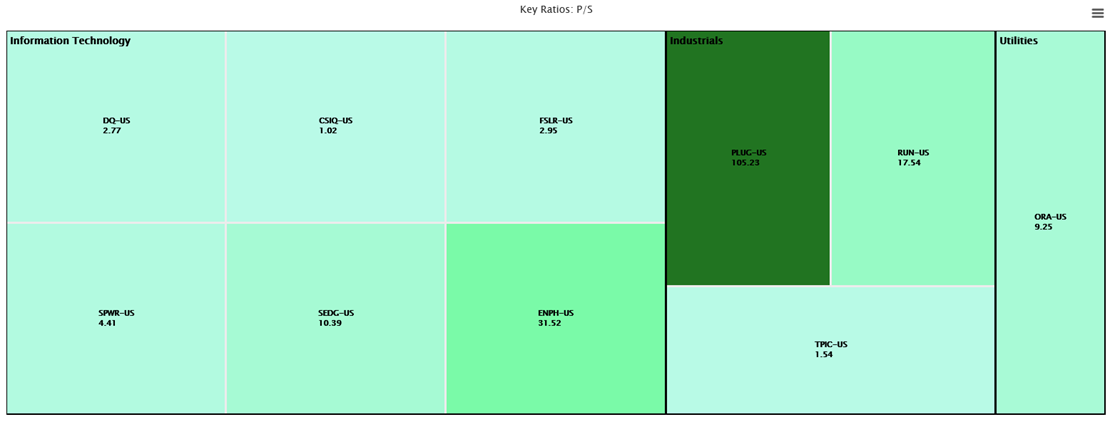
Source: ETF Action
How We Did It: Under the "Clean Energy Select Top 10", select the "Stock Visualizer" button, then choose "P/E" (under "Key Ratios") from the "Data Point" drop down menu.
Note: Requires Professional subscription
While all of the ETF All-Stars® stocks have positive P/S ratios, three have much higher sales multiples than the rest: SunRun (RUN) at 17.54; Enphase (ENPH) at 31.52, and Plug Power (PLUG), at 105.23.
That said, a P/S ratio doesn't account for earnings. When we look at P/E ratios instead, we see much more variation:
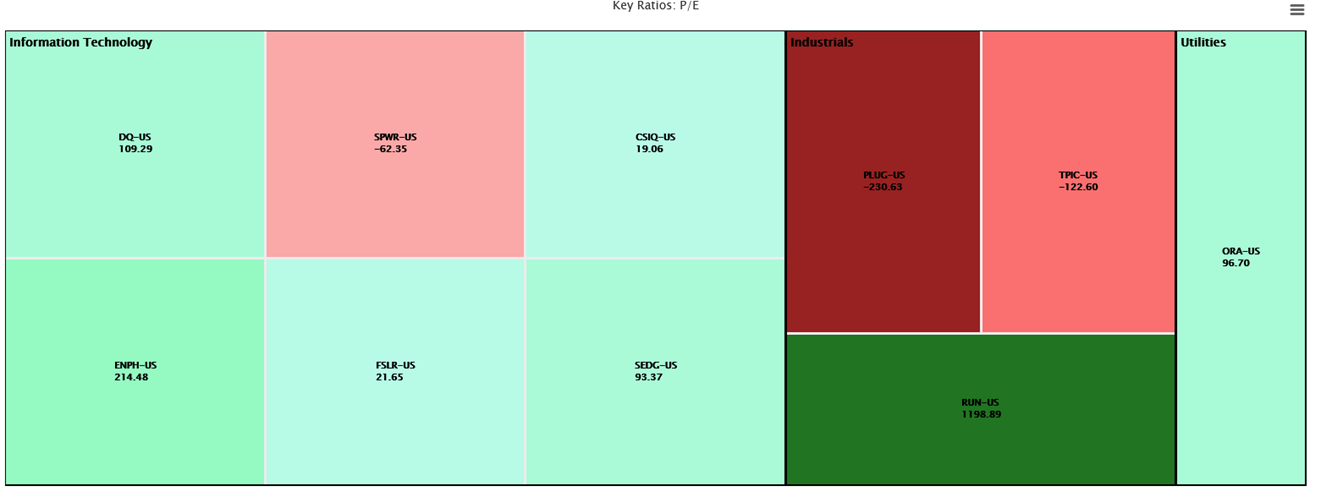
Source: ETF Action
How We Did It: Under the "Clean Energy Select Top 10", select the "Stock Visualizer" button, then choose "P/E" (under "Key Ratios") from the "Data Point" drop down menu.
Note: Requires Professional subscription
Enphase has a P/E ratio of 214—which is the 10th highest P/E ratio of any stock in the S&P 500 Index, clean energy or no, while SunRun Inc. (RUN)'s P/E ratio is 1199, so high that it's only 140 points below Tesla (TSLA).
Meanwhile, Plug Power (PLUG)'s P/E ratio is actually negative, at -231. What gives?
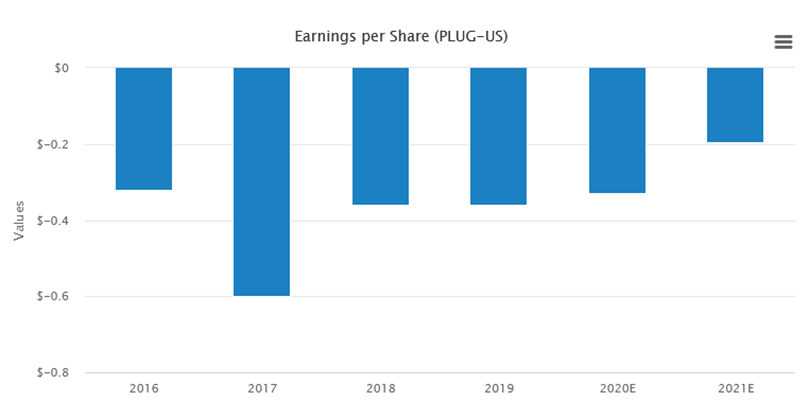
Zooming In On Plug Power (PLUG)
On the one hand, a negative P/E ratio isn't exactly a great sign, as it generally indicates the company is losing money. However, this is a case where the context really matters.
Plug Power has consistently lost money for the past five years. And while analysts estimate that Plug Power's 2021 earnings will grow by 41%, that still won't be enough to turn the company's earnings positive and stem the bleeding:
Source: ETF Action
How We Did It: Type a ticker into the Portfolio Visualizer > Single Stock for the single stock page, then navigate to the Fundamentals tab. You can also reach single stock pages by clicking on the stock's ticker in the "Stock Visualizer" heatmap.
That said, for years, Plug Power traded at much smaller share prices:
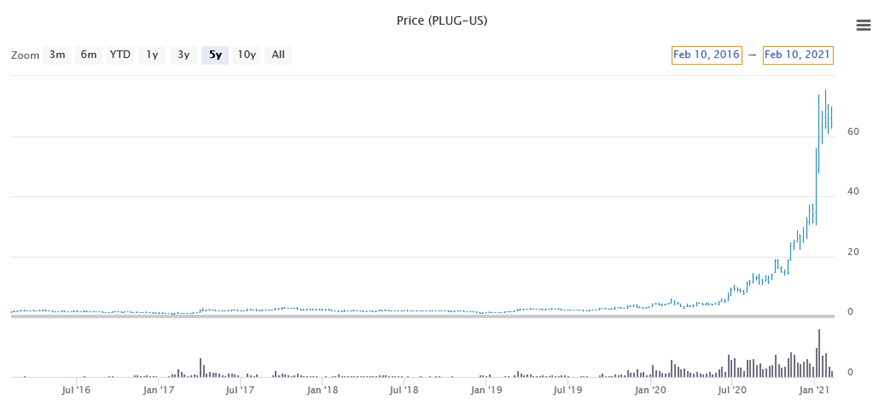
Source: ETF Action
How We Did It: Type a ticker into the Portfolio Visualizer > Single Stock for the single stock page. You can also reach single stock pages by clicking on the stock's ticker in the "Stock Visualizer" heatmap.
Meaning that there's probably a fair bit of noise in Plug Power's historical data: When a share price is small, any change can result in big percentage swings. With negative P/E ratios specifically, big numbers can be especially misleading—and in fact, the larger a negative P/E ratio's value, the closer that stock may be to profitability.
Looking ahead to 2021 earnings estimates, Plug Power's estimated earnings growth is fairly solid, though TPI Composites (TPIC) has the highest expected 2021 earnings growth of all our clean energy ETF All-Stars®.
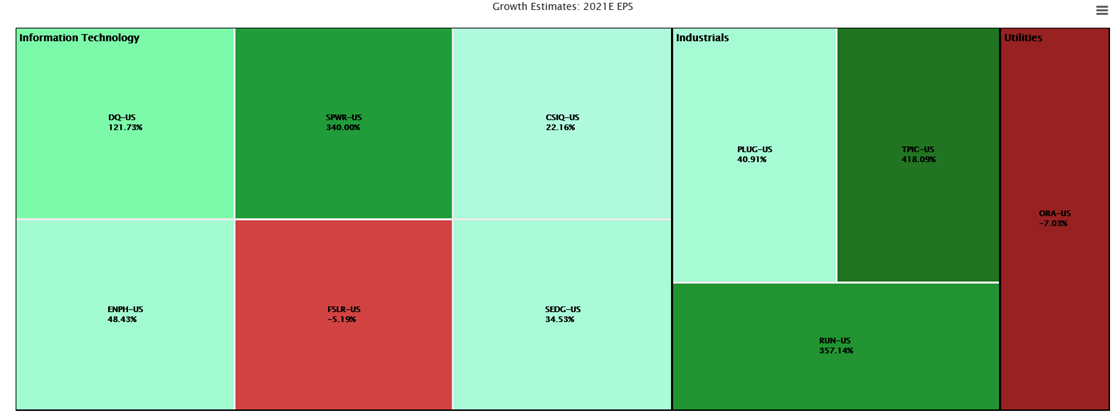
Source: ETF Action
How We Did It: Under the "Clean Energy Select Top 10", select the "Stock Visualizer" button, then choose "2021E EPS" (under "Growth Estimates") from the "Data Point" drop down menu.
Note: Requires Professional subscription
Look To The Metrics
In ETF Land, we're fond of saying that investors have to "look under the hood"—meaning, they should check inside the portfolio to truly understand what they own.
But the same is true in Equity Land, too. Yes, clean energy is a hot theme. But stock pickers should be wary of being swayed simply by a winning story and a rising share price. There are still metrics that matter, that have always mattered: earnings, sales, cash flow—the metrics of success. And there's always more to the story than just strong recent returns.
Lara Crigger is the Editor-In-Chief of ETF Action. Contact her at lara@etfaction.com.
Want to get this story and stories like it delivered right to your inbox?
Sign up to receive The Morning Focus newsletter.